


Environmental simulations were embedded directly into the design loop to evaluate daylight penetration and visual connectivity. By iterating façade openness, skin articulation, and building placement, the system balances solar access with spatial quality. Optimization tools such as Galapagos were used to identify configurations that achieve maximum daylight and views while respecting other constraints.
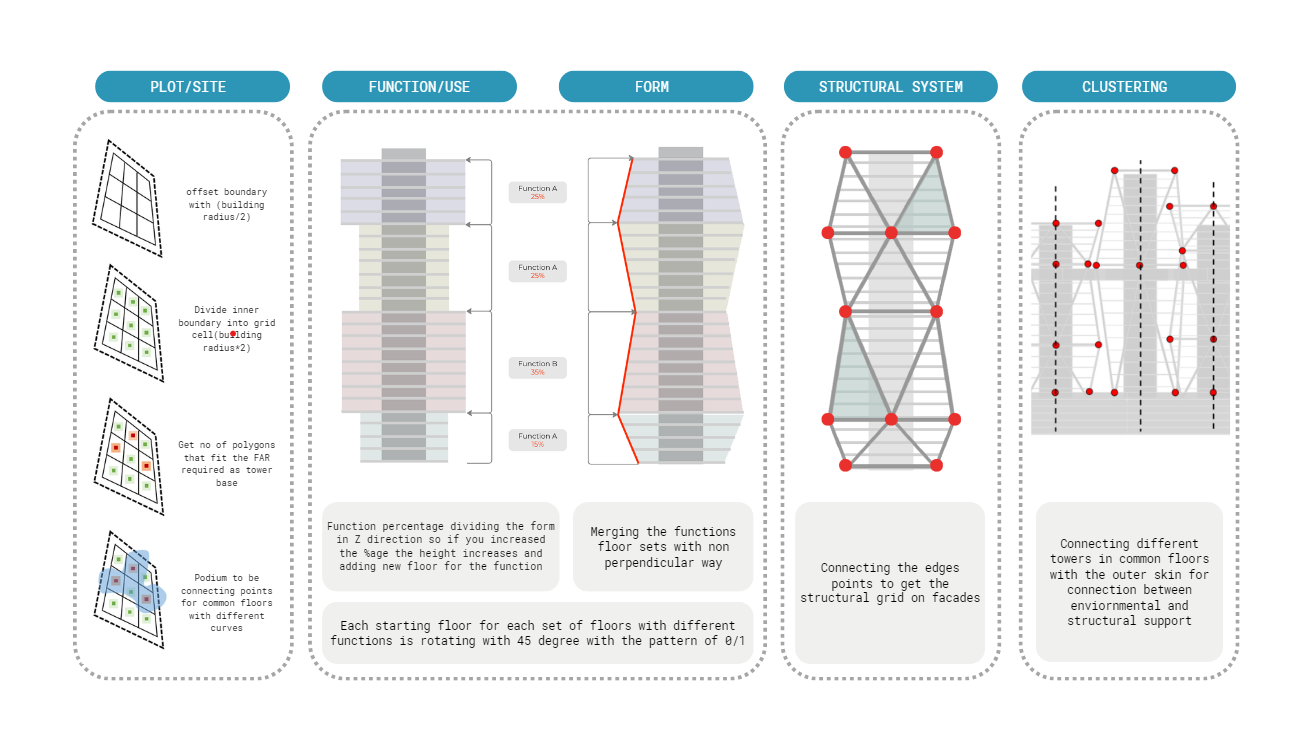
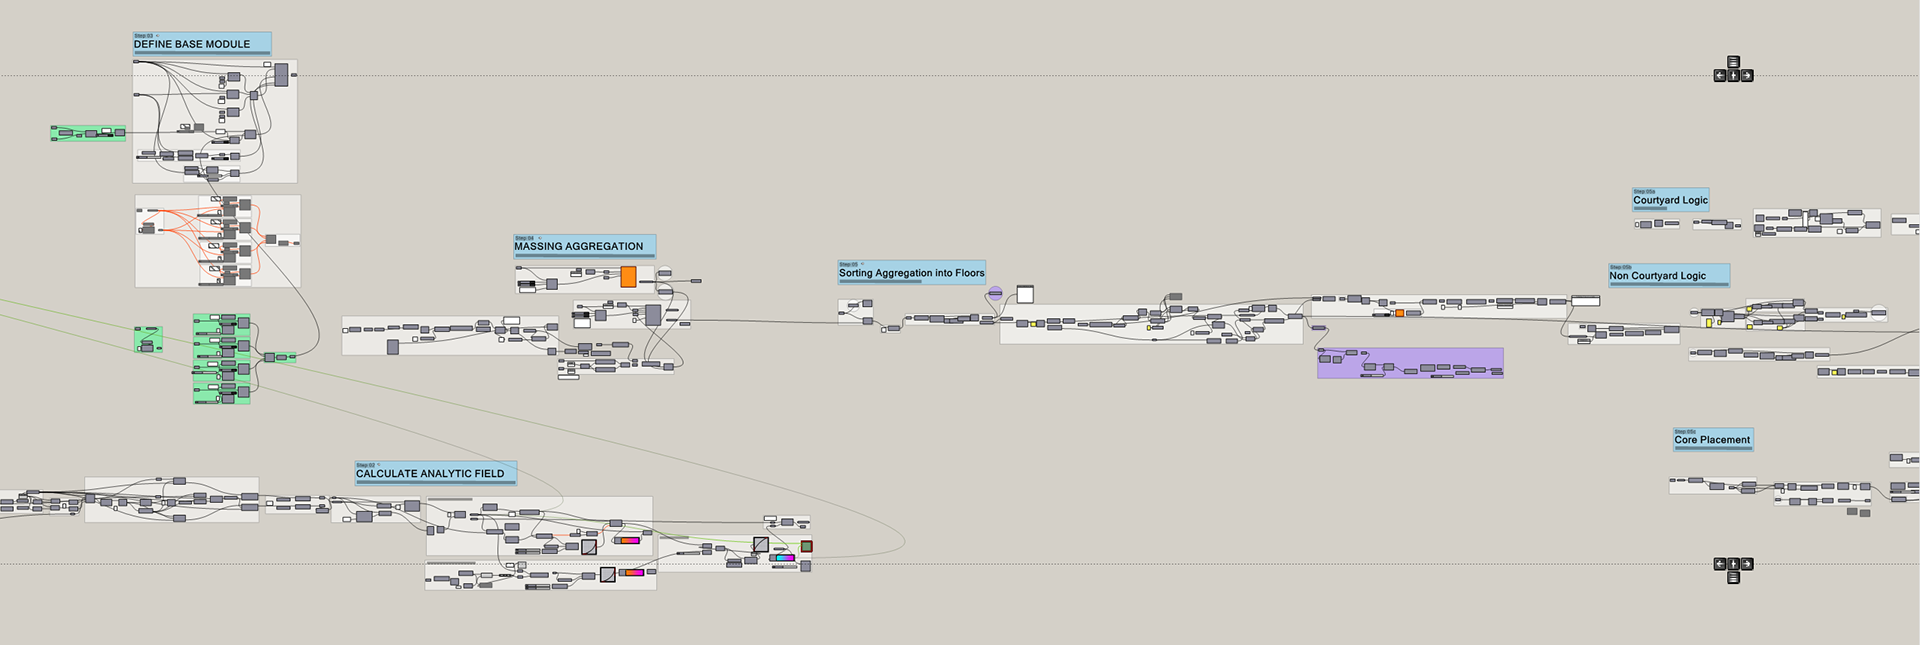
The workflow diagram represents the sequential logic of the generative system, from site and program inputs to massing, structural systems, and spatial organization. Each stage feeds back into the next, enabling iterative refinement. This pipeline allows the model to test multiple configurations rapidly, making performance-driven decision-making integral to the design process.
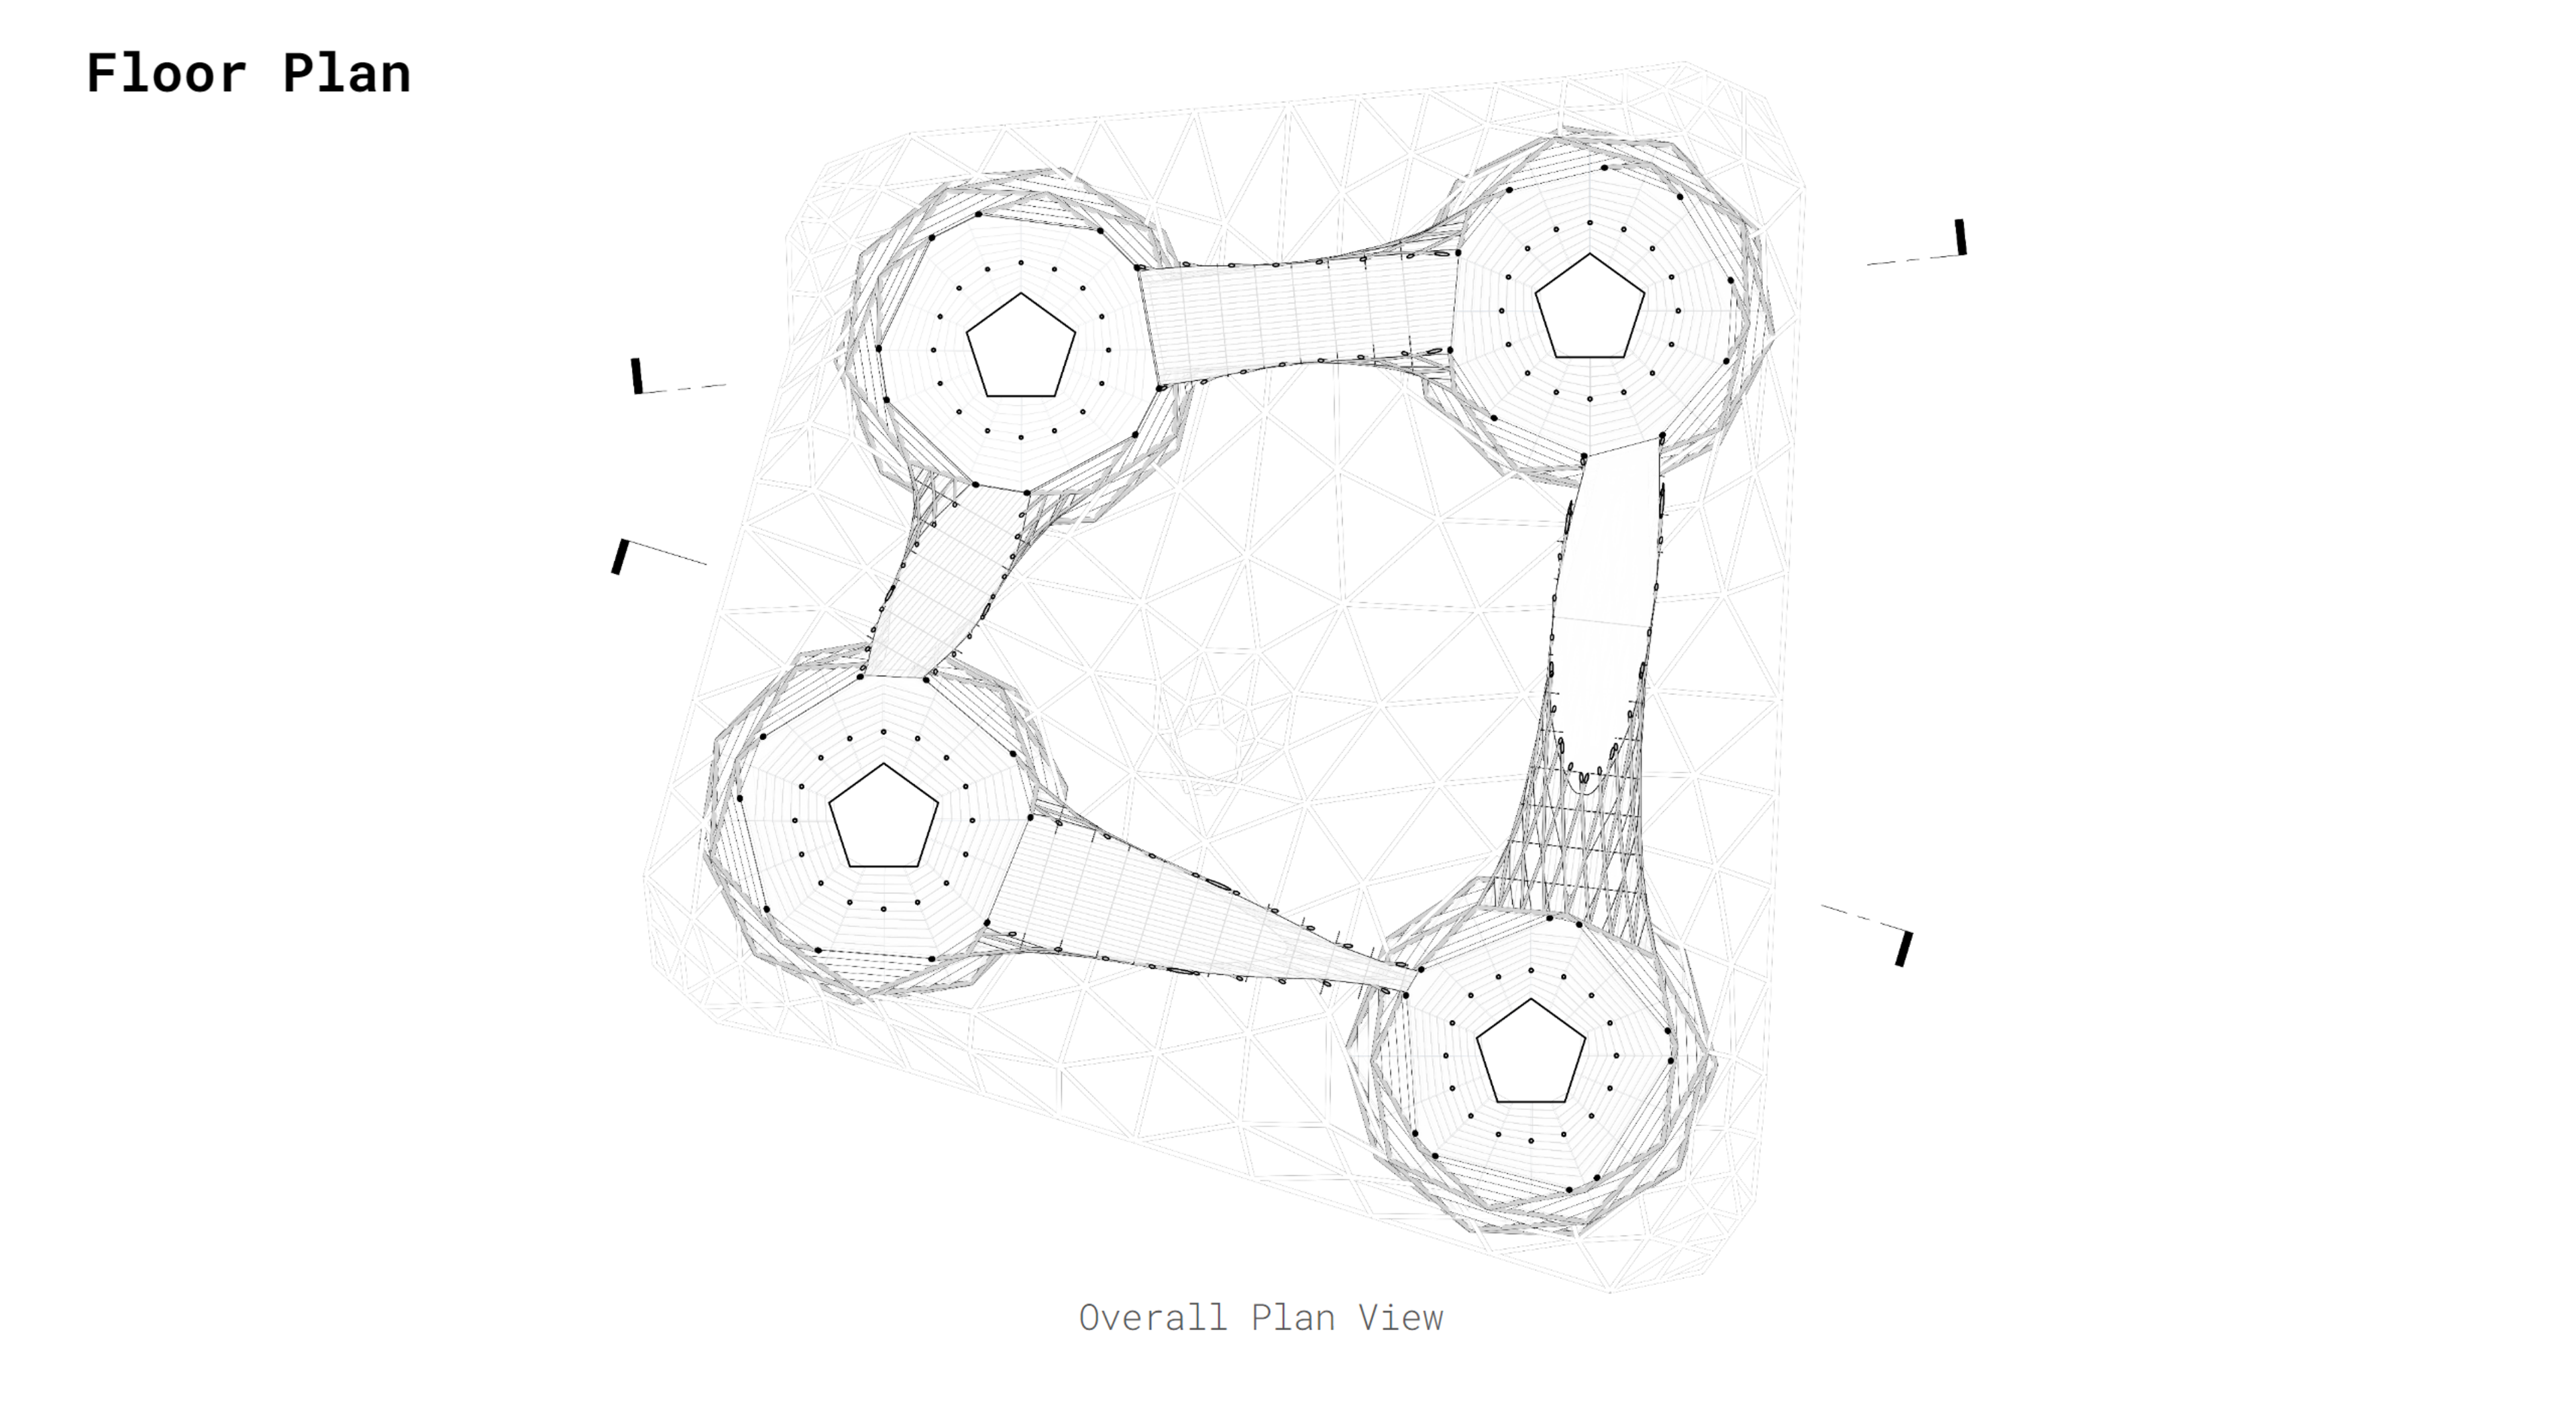
The design process begins by translating site boundaries and contextual constraints into parametric inputs. These inputs drive the generation of building envelopes, ensuring that geometry remains responsive to changing plot dimensions, regulations, and programmatic needs. This approach allows the model to remain adaptable across multiple scenarios while maintaining a consistent architectural logic.

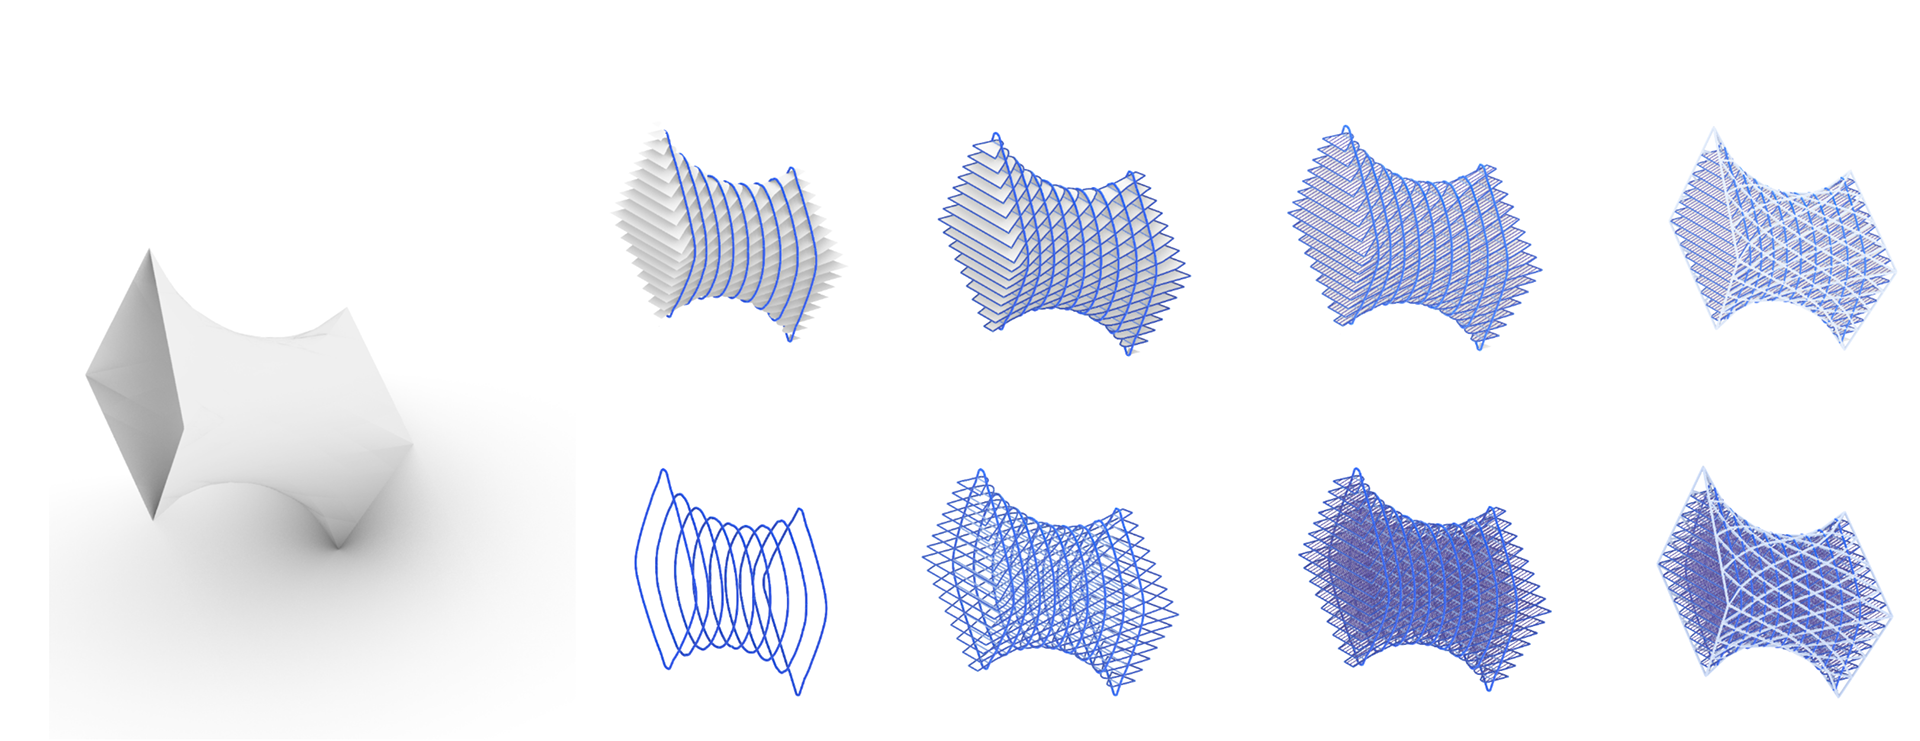
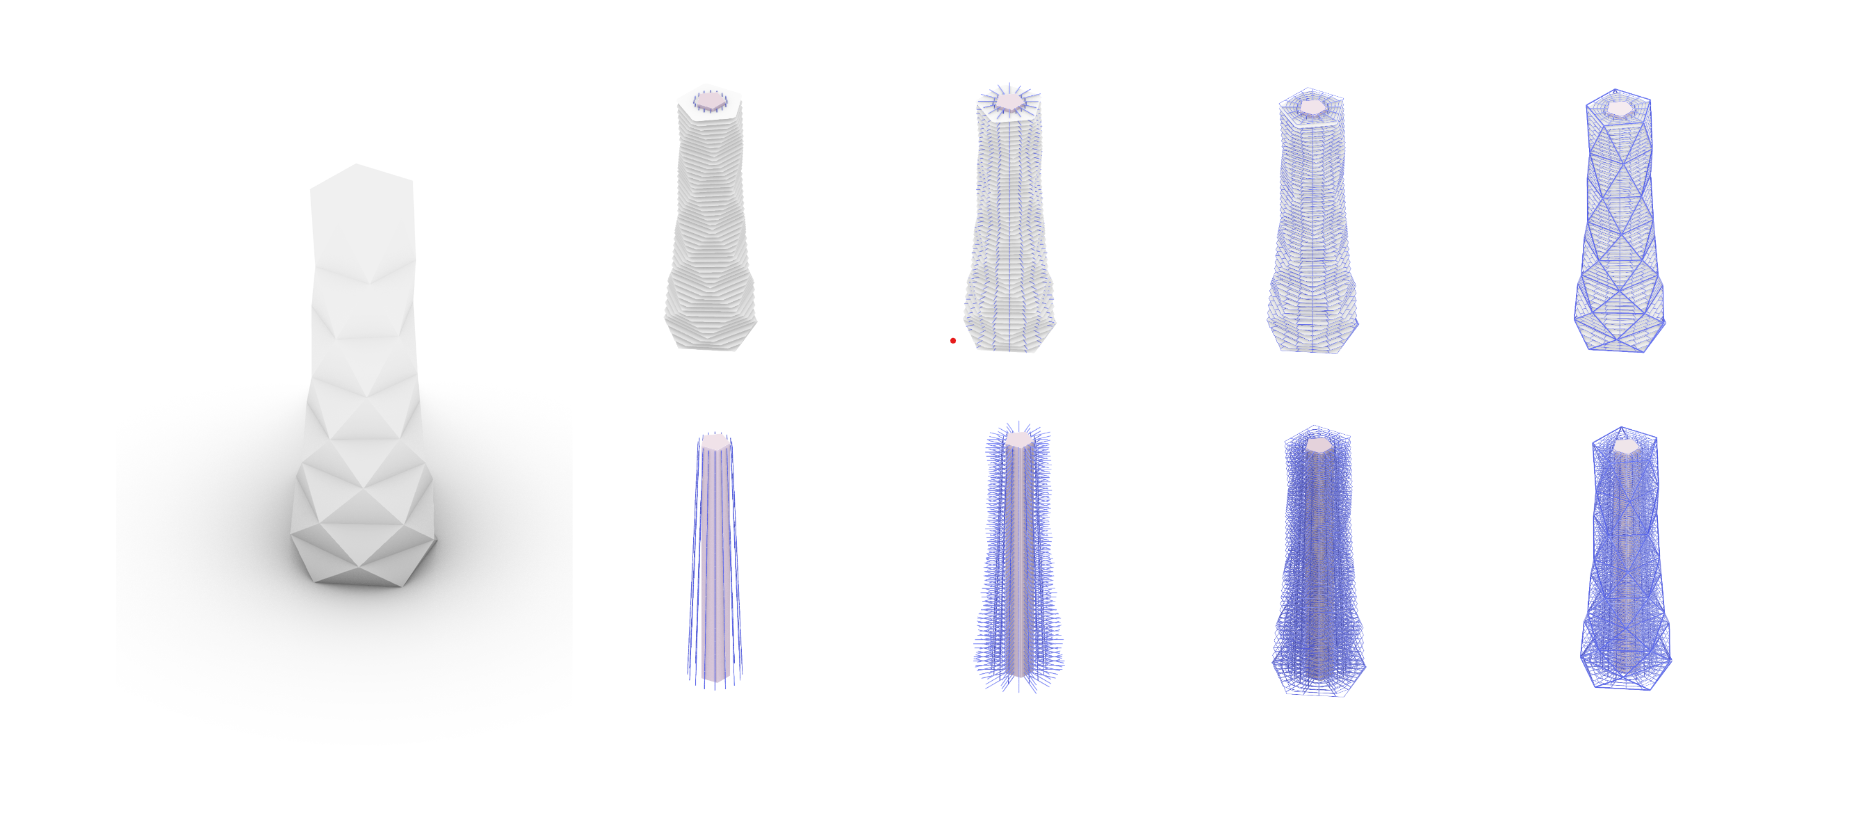
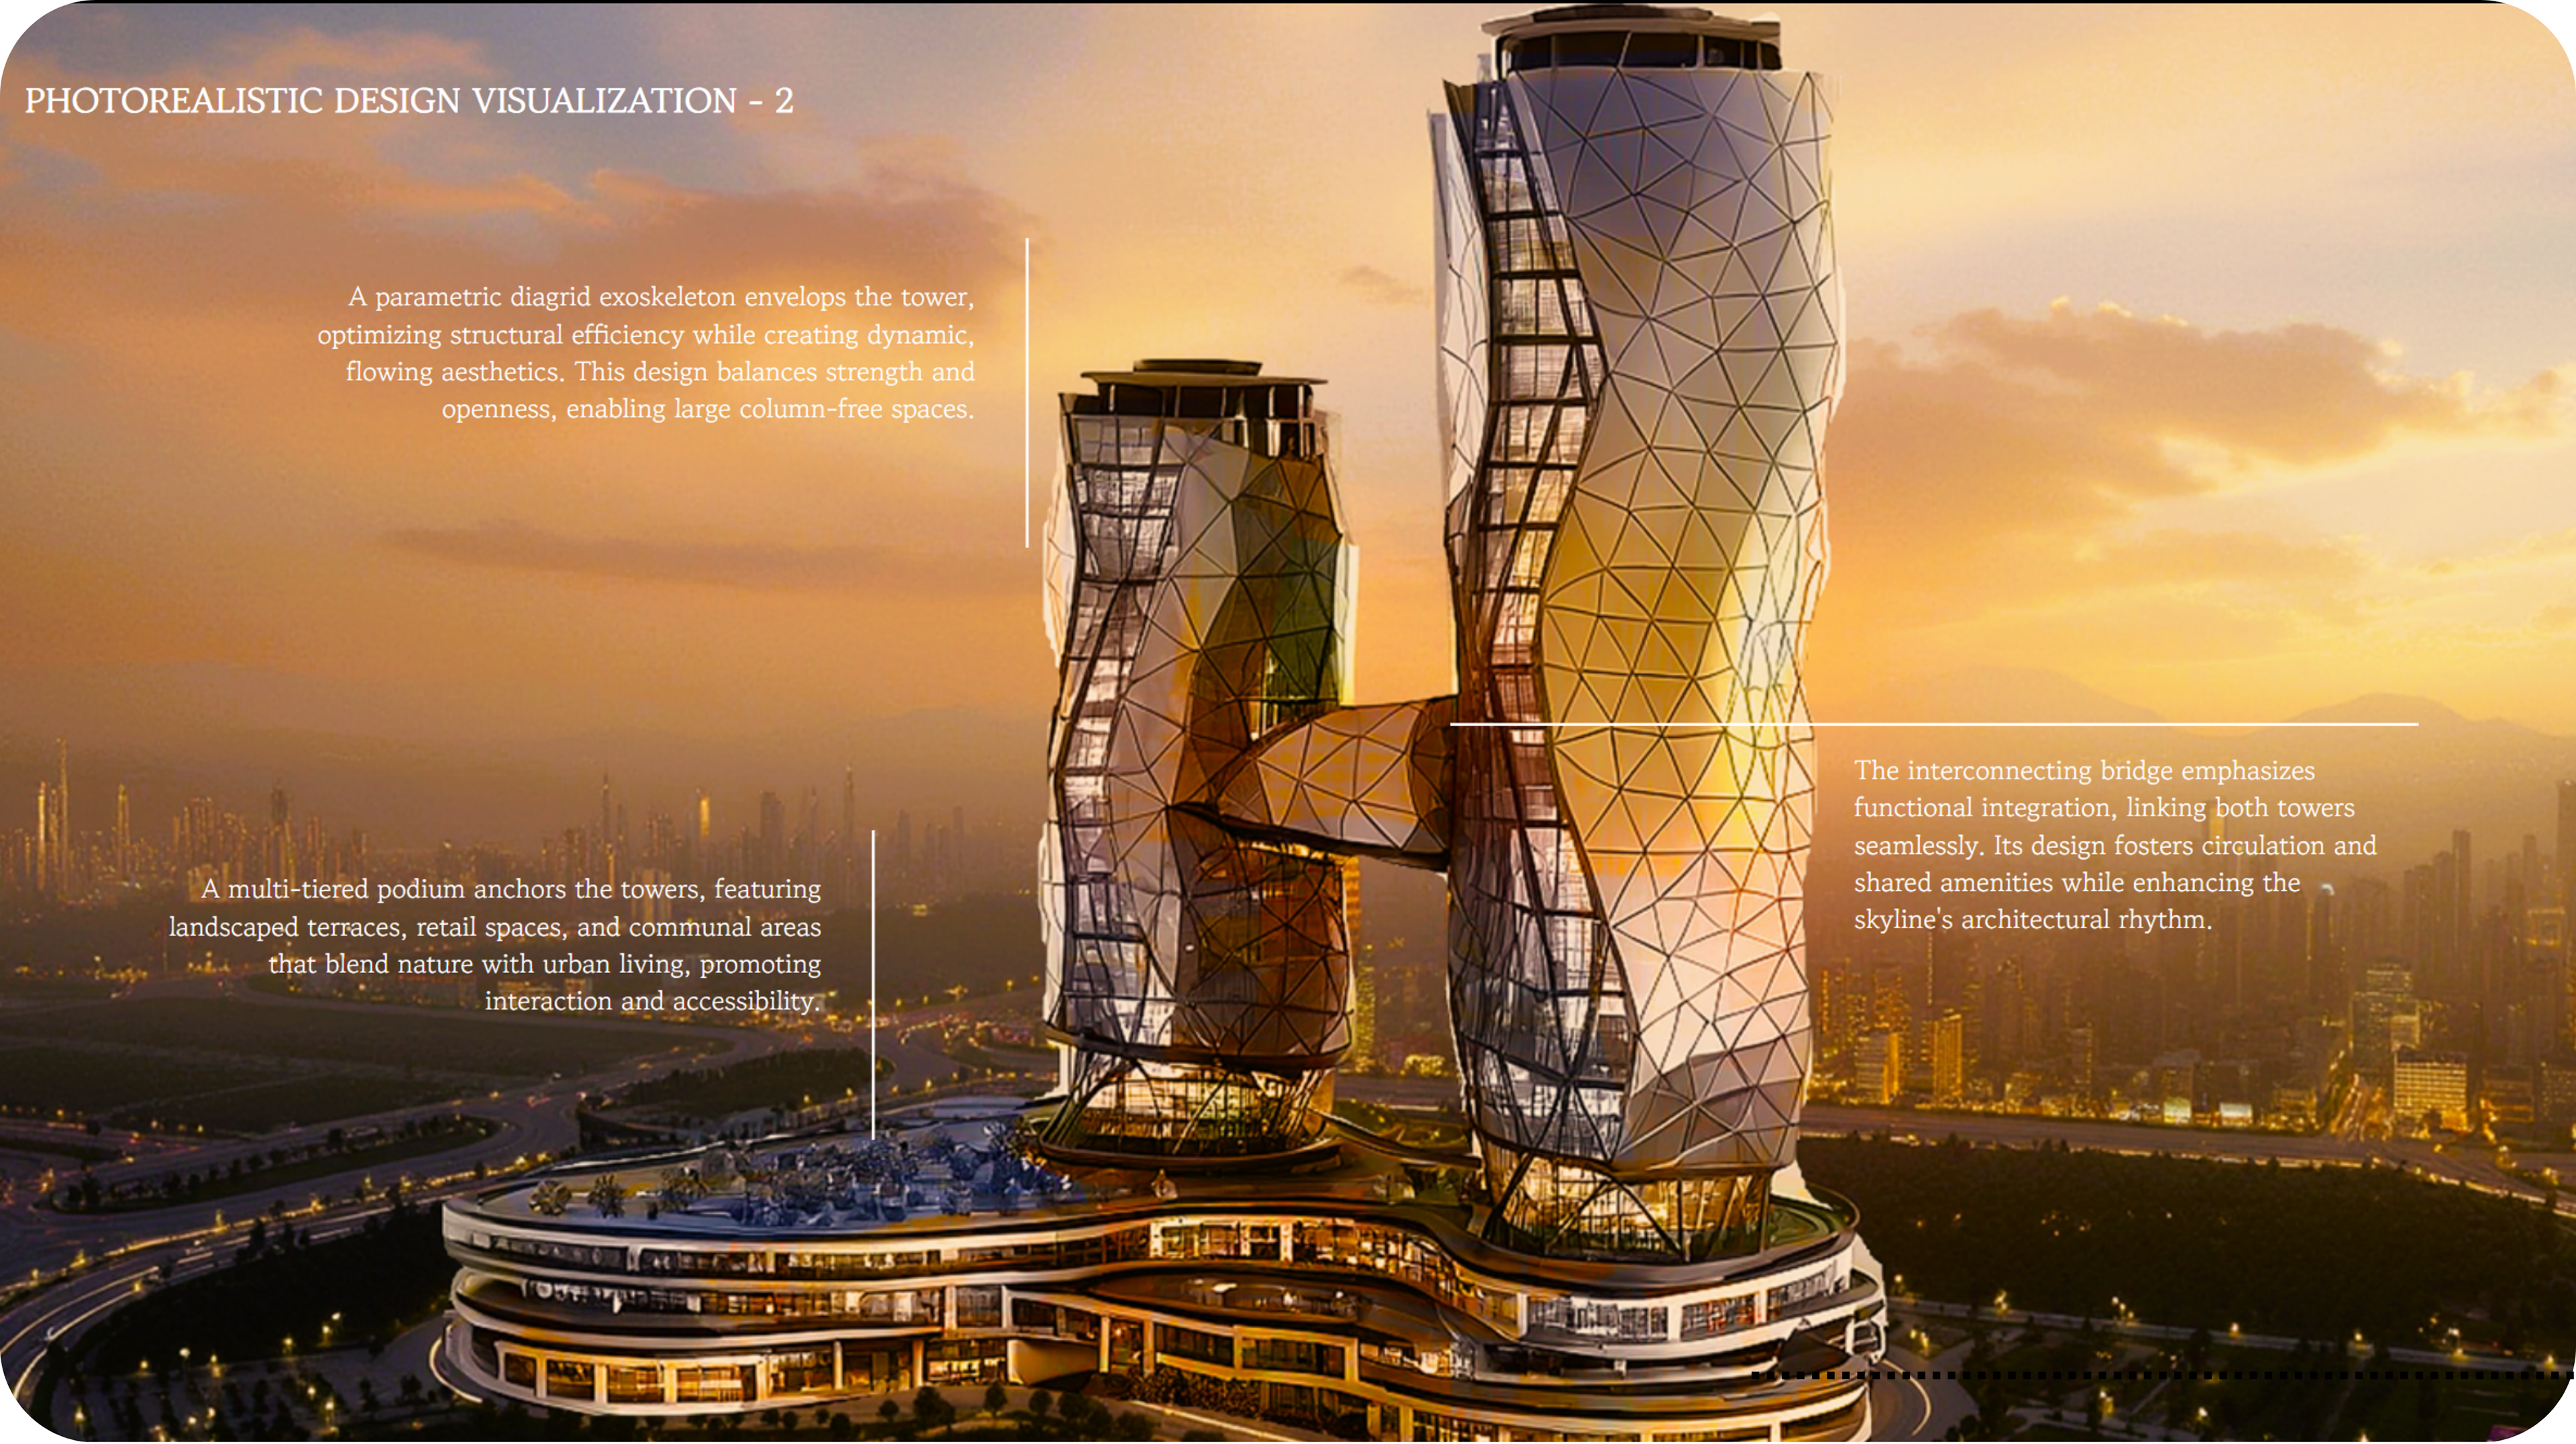
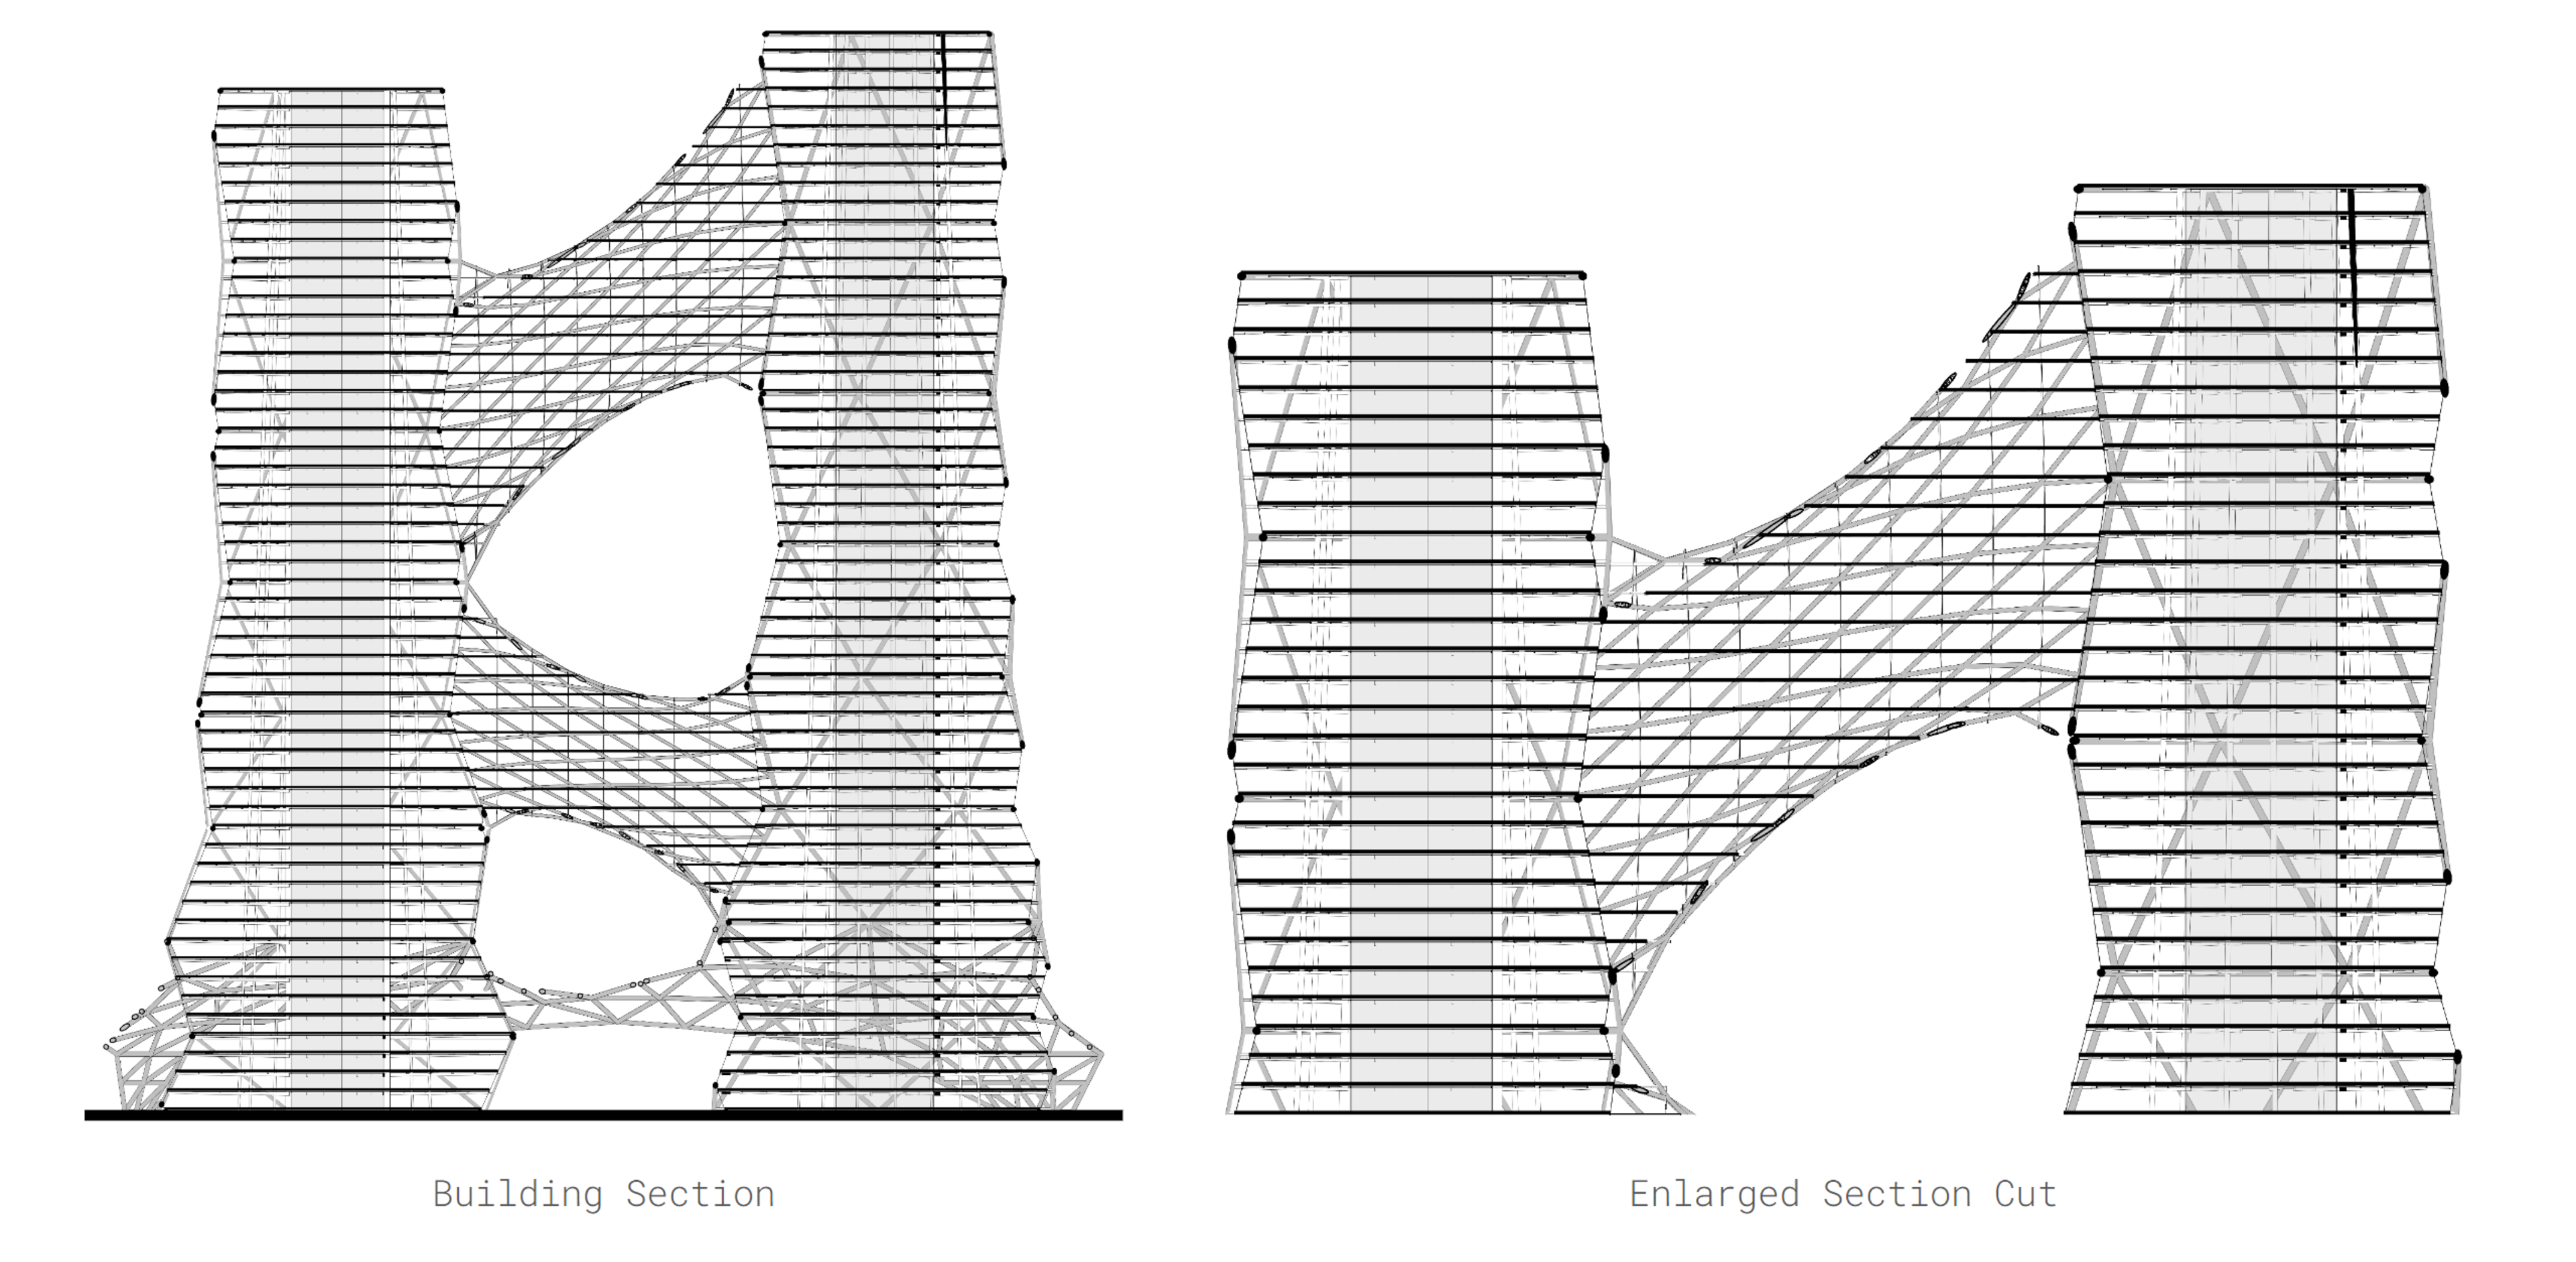
The diagrid exoskeleton operates as both a structural and architectural system. It optimizes material efficiency, reduces internal columns, and enables large open floor plates. Parametric control over grid density, joint placement, and panelization allows the structure to adapt locally to stresses, programmatic needs, and façade articulation.
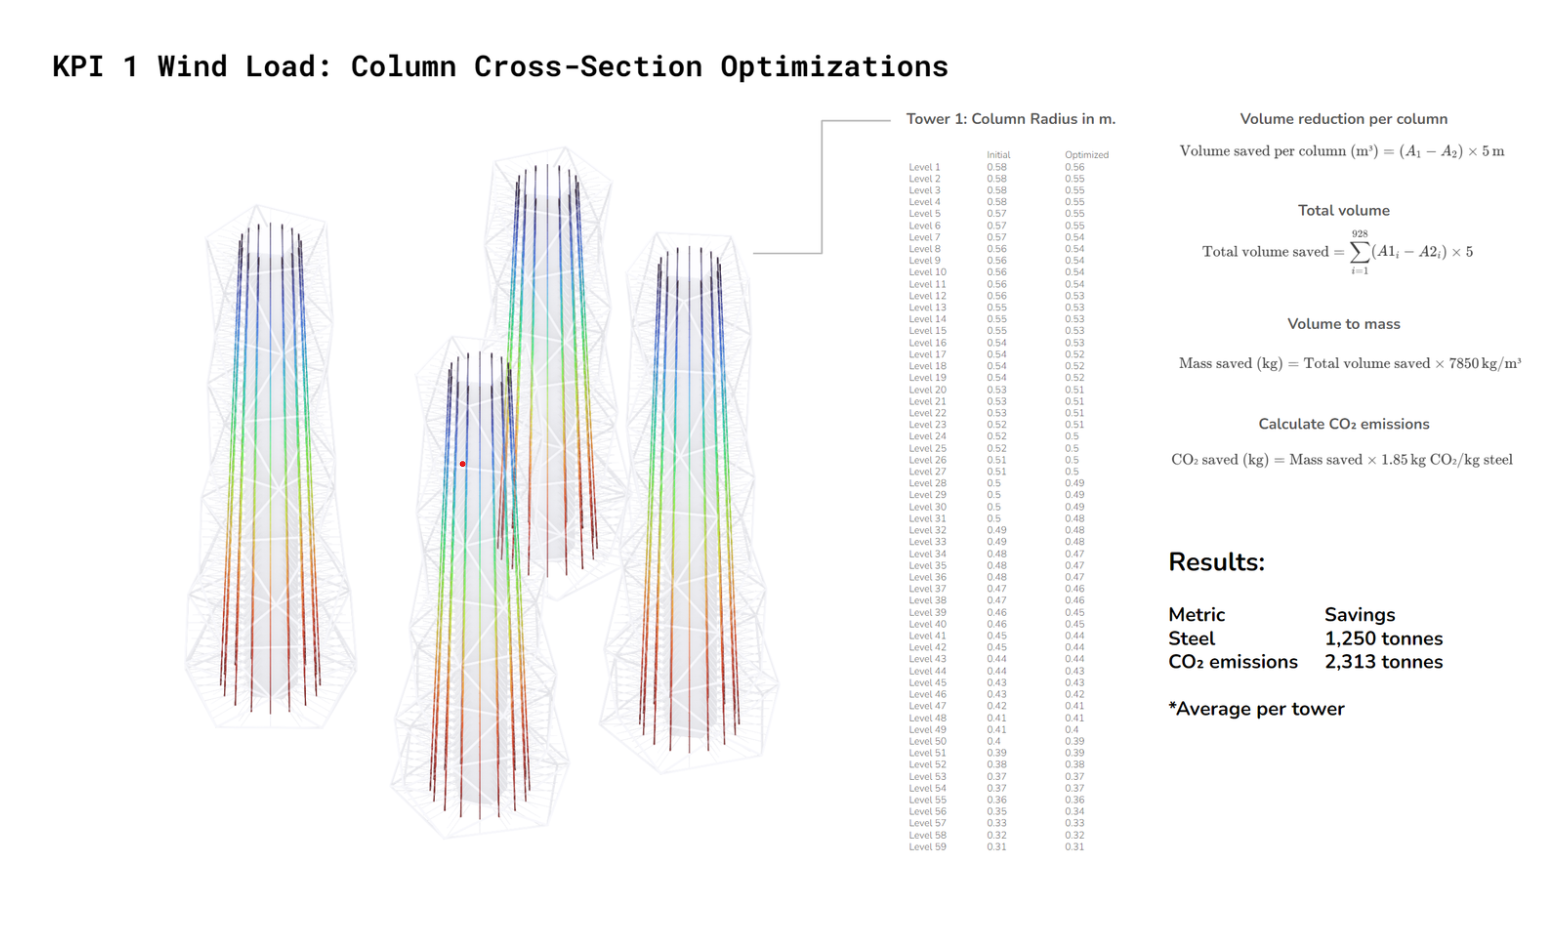
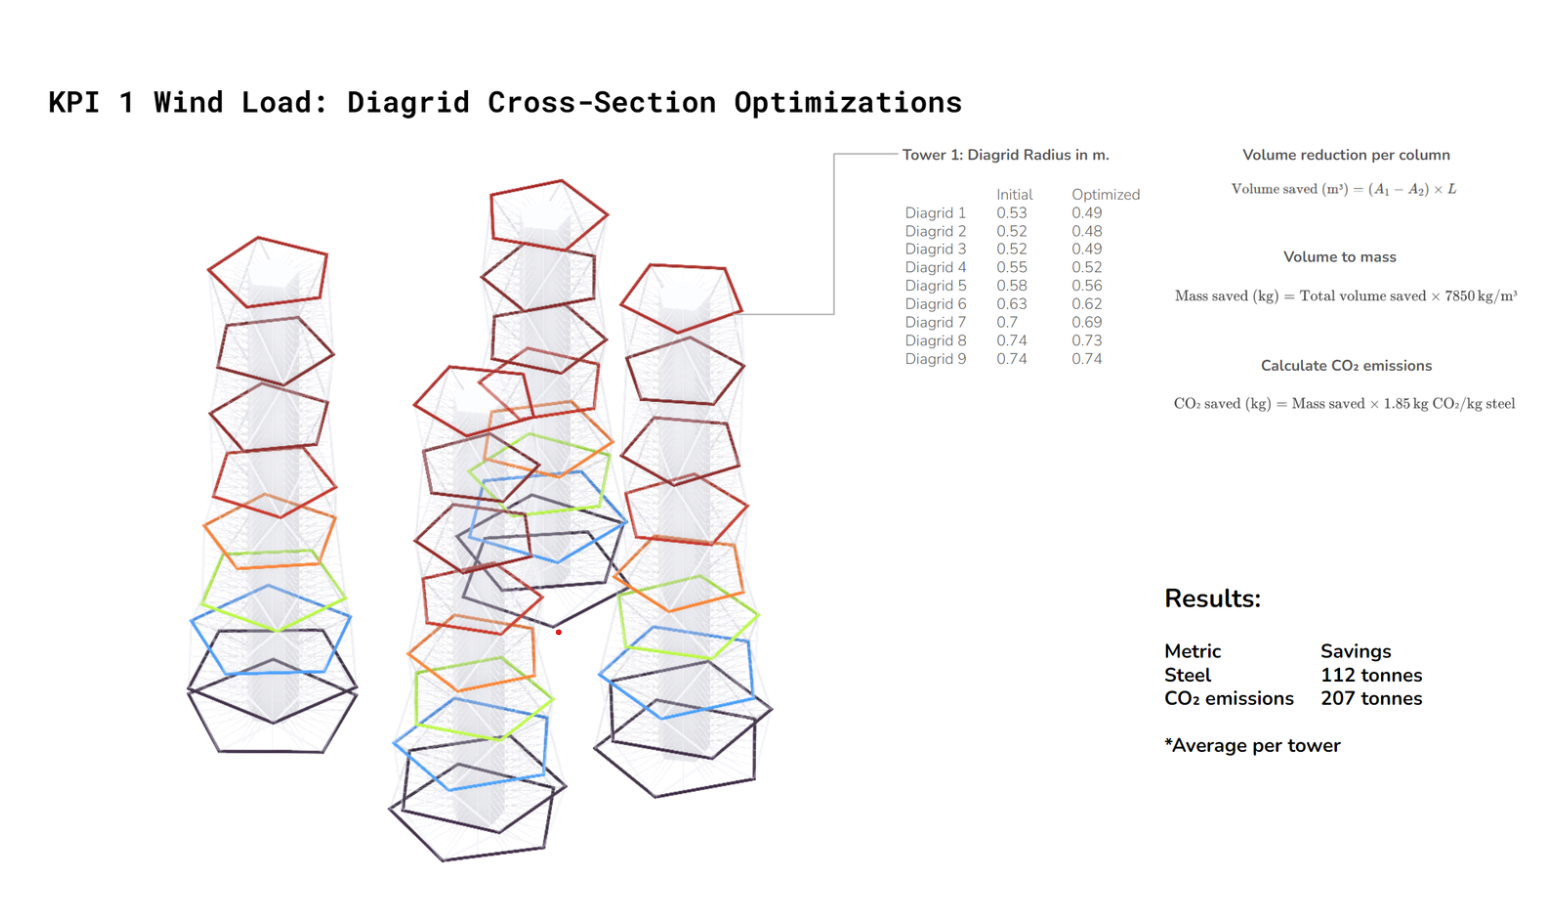
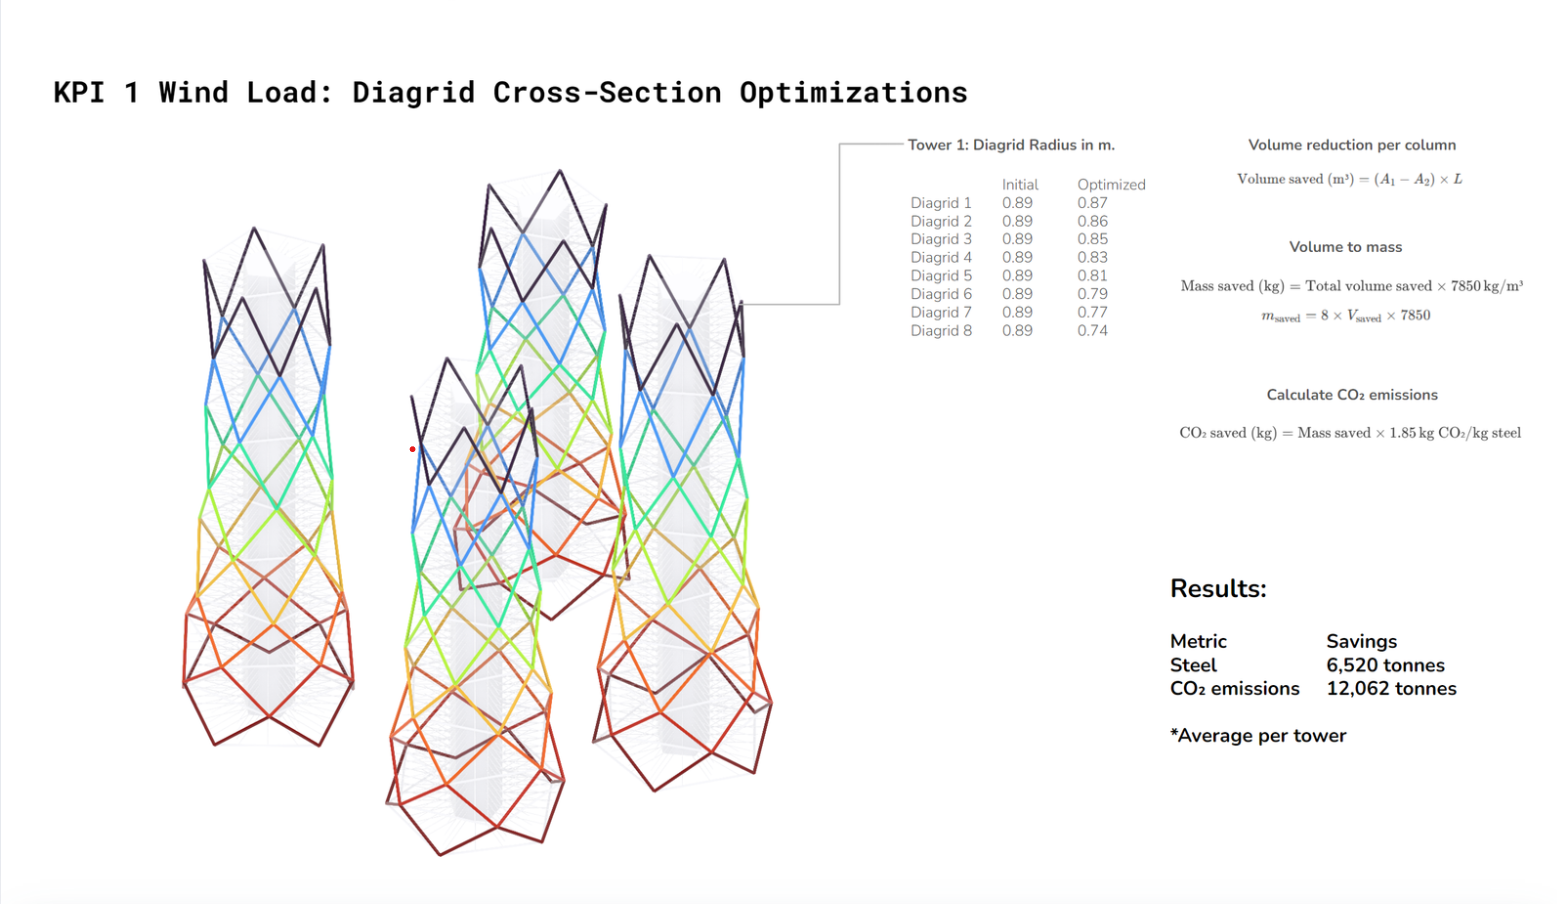
The middle row focuses on "KPI 1: Diagrid Cross-Section Optimizations," presented in two views. The first shows a stack of color-coded polygonal shapes representing the diagrid's cross-sections, while the second presents full 3D models of the diagrid structure. Both views include tables detailing "Tower 1: Diagrid Radius (in m)" with "Initial" and "Optimized" values for different elements, as well as calculations for volume, mass, and CO2 emissions. The results from the first view show Steel Savings of 112 tonnes and CO2 emissions Savings of 207 tonnes, while the second view shows more substantial Steel Savings of 6,520 tonnes and CO2 emissions Savings of 12,062 tonnes.
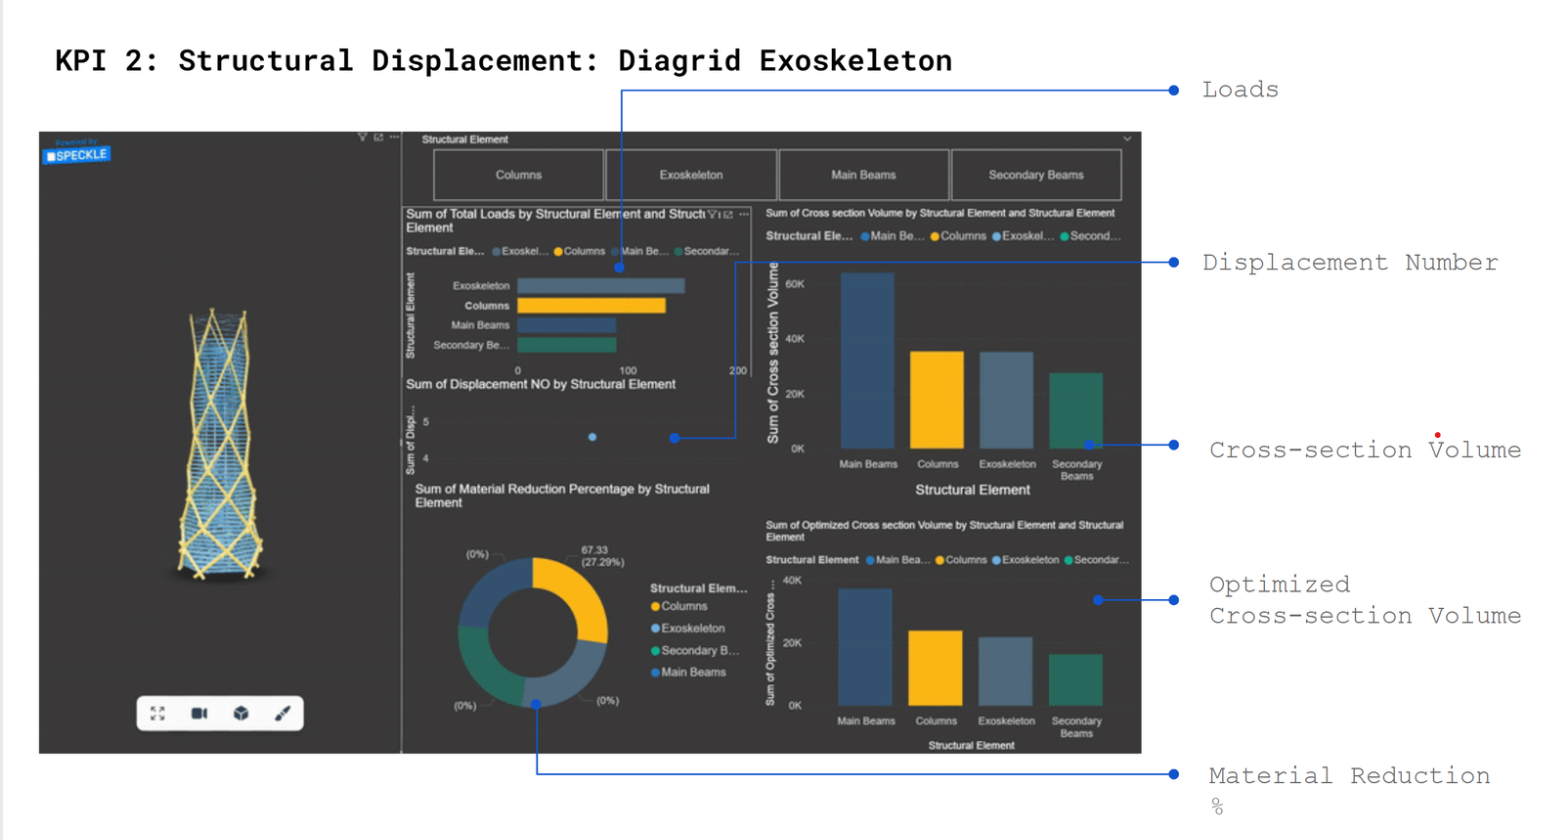
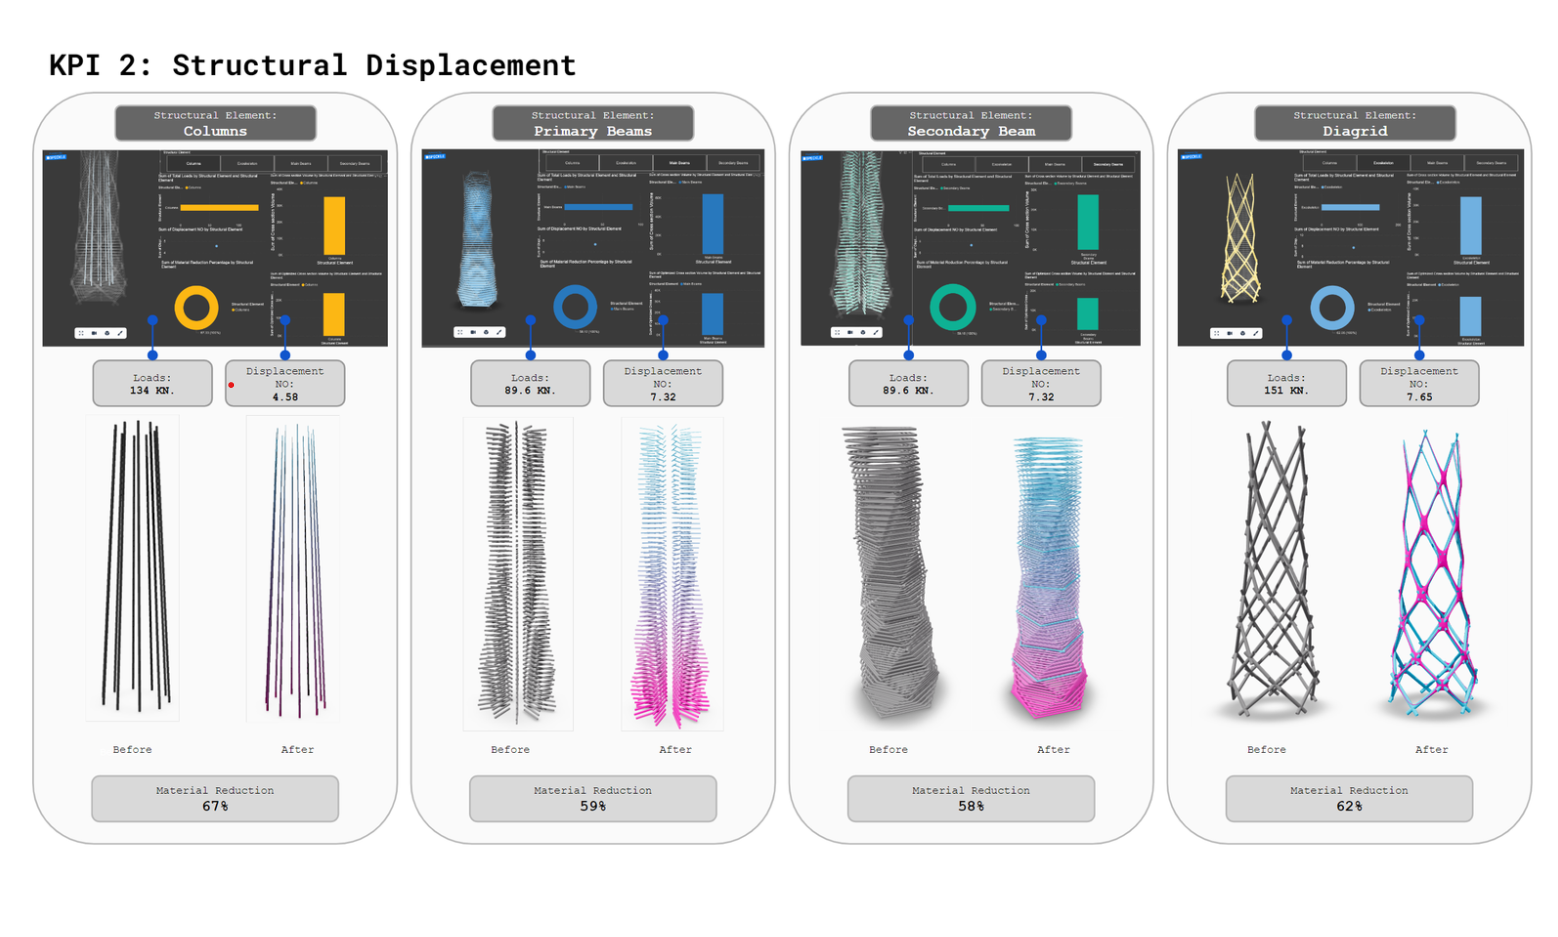
The final row addresses "KPI 2: Structural Displacement." The first section is a dashboard screenshot labeled "KPI 2: Structural Displacement: Diagrid Exoskeleton," featuring a 3D model of the tower and several charts analyzing metrics like "Loads," "Displacement Number," "Cross-section Volume," and "Optimized Cross-section Volume." The second section, also titled "KPI 2: Structural Displacement," compares the displacement of four different systems: "Columns," "Primary Beams," "Secondary Beams," and "Diagrid." For each, visual representations show the structure "before" and "after" optimization, illustrating the reduction in displacement, with bar charts quantifying the displacement and 3D models providing visual context.
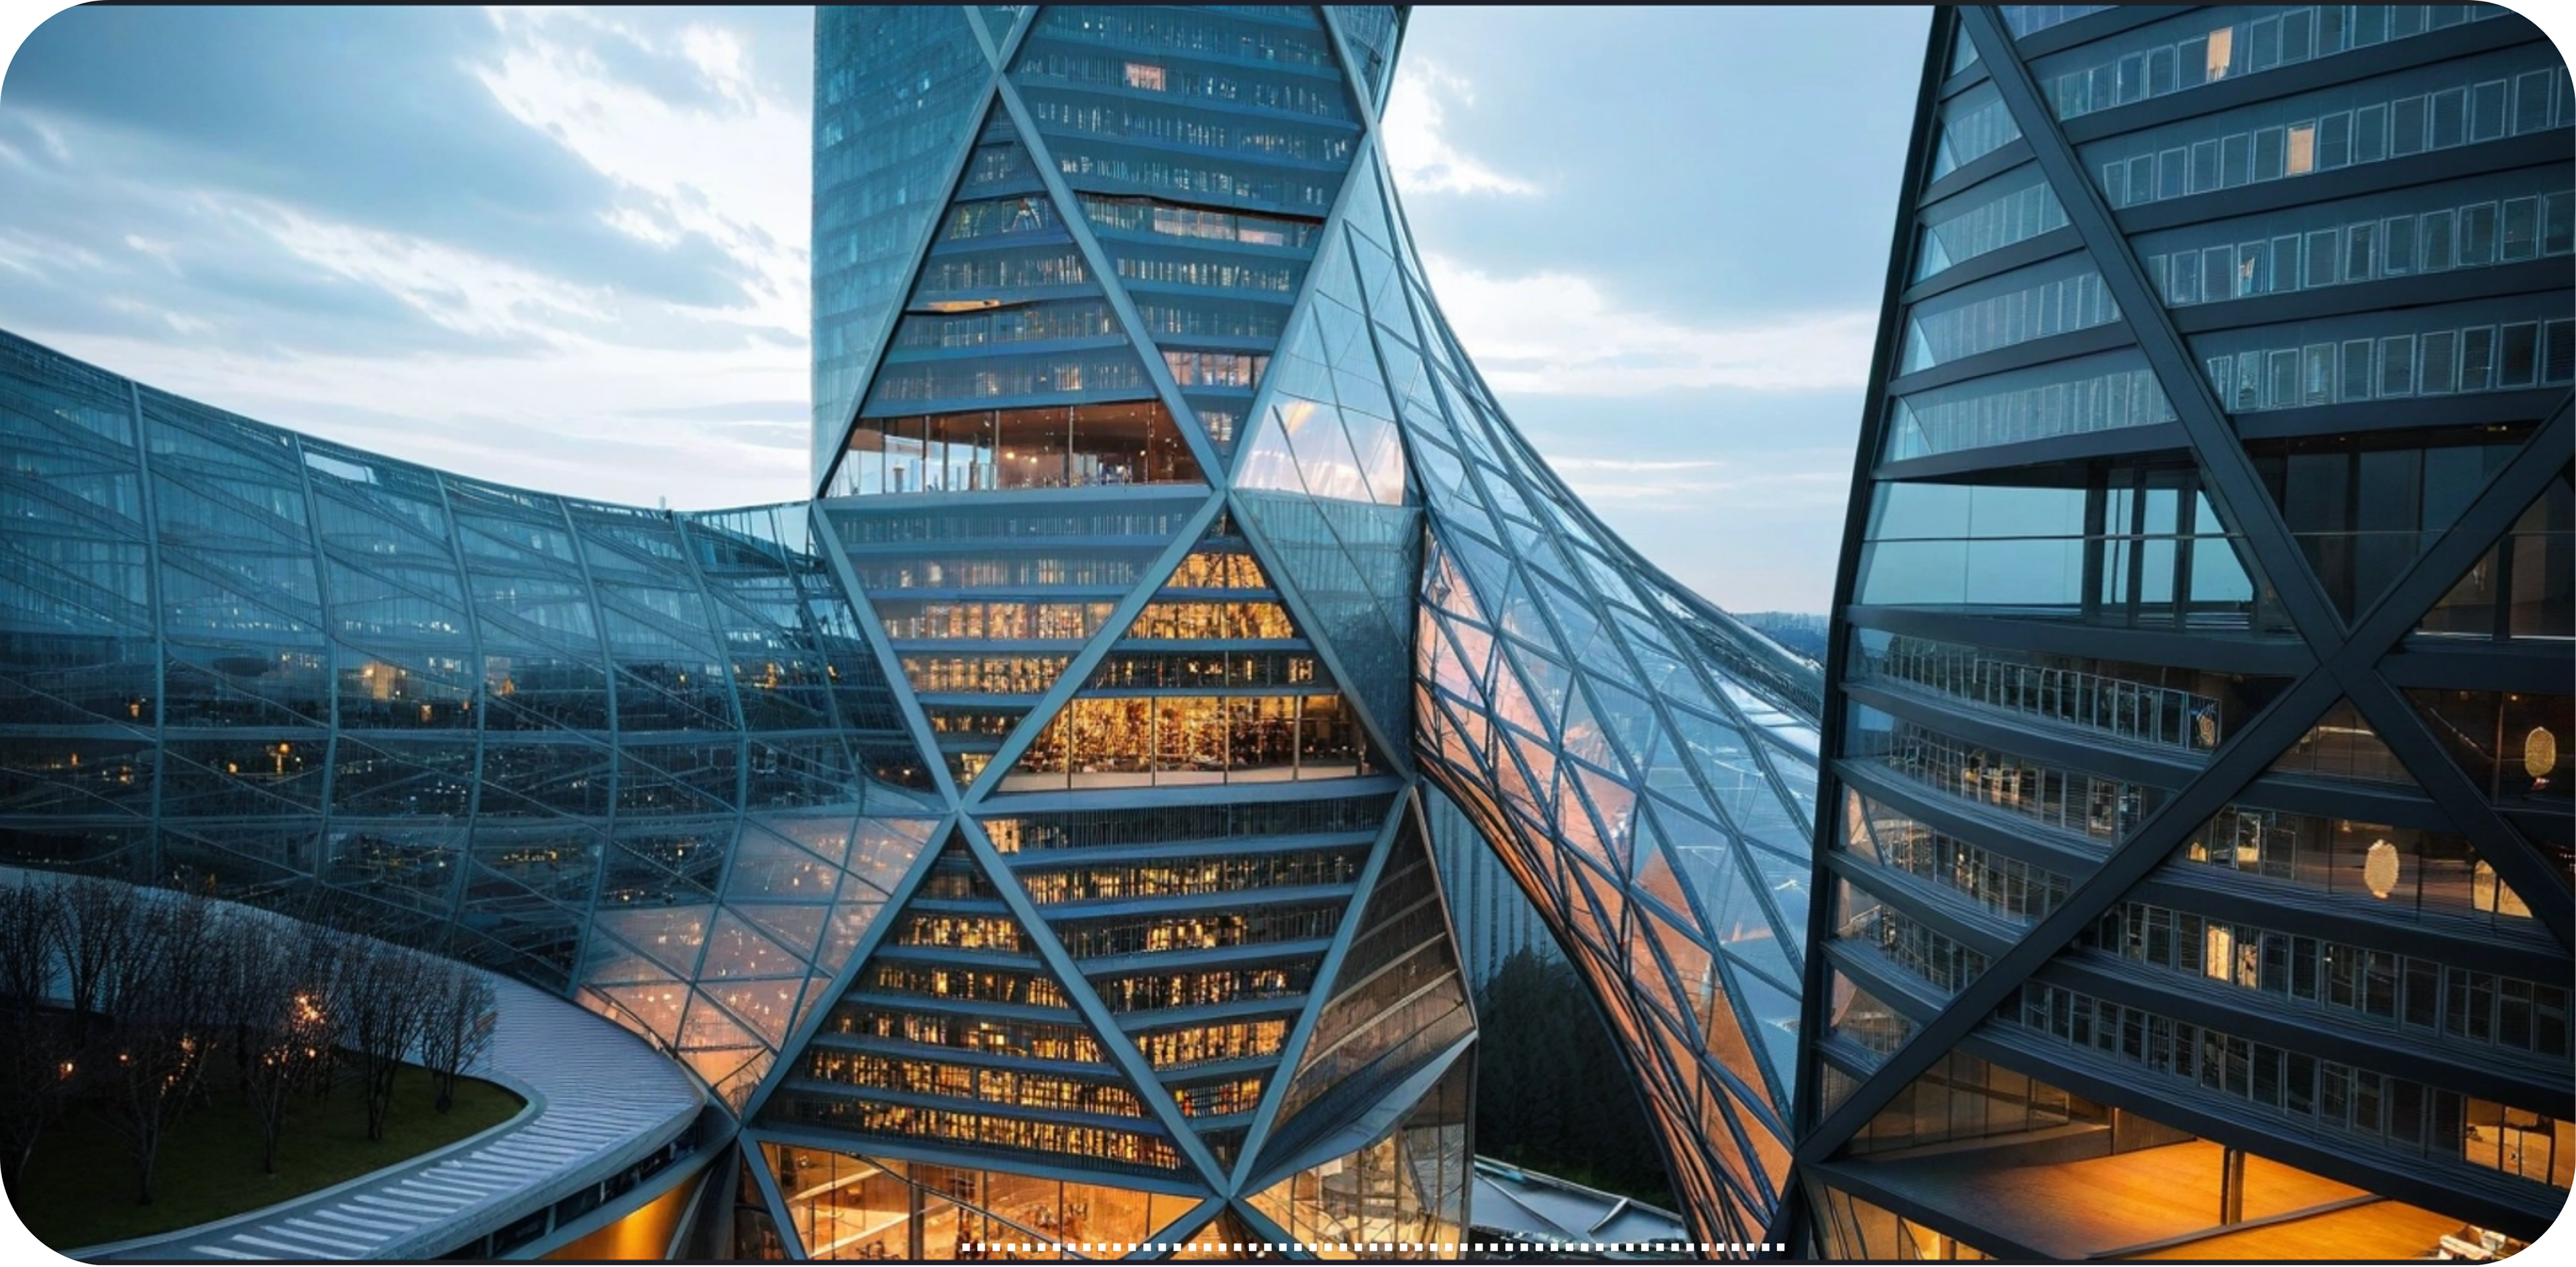
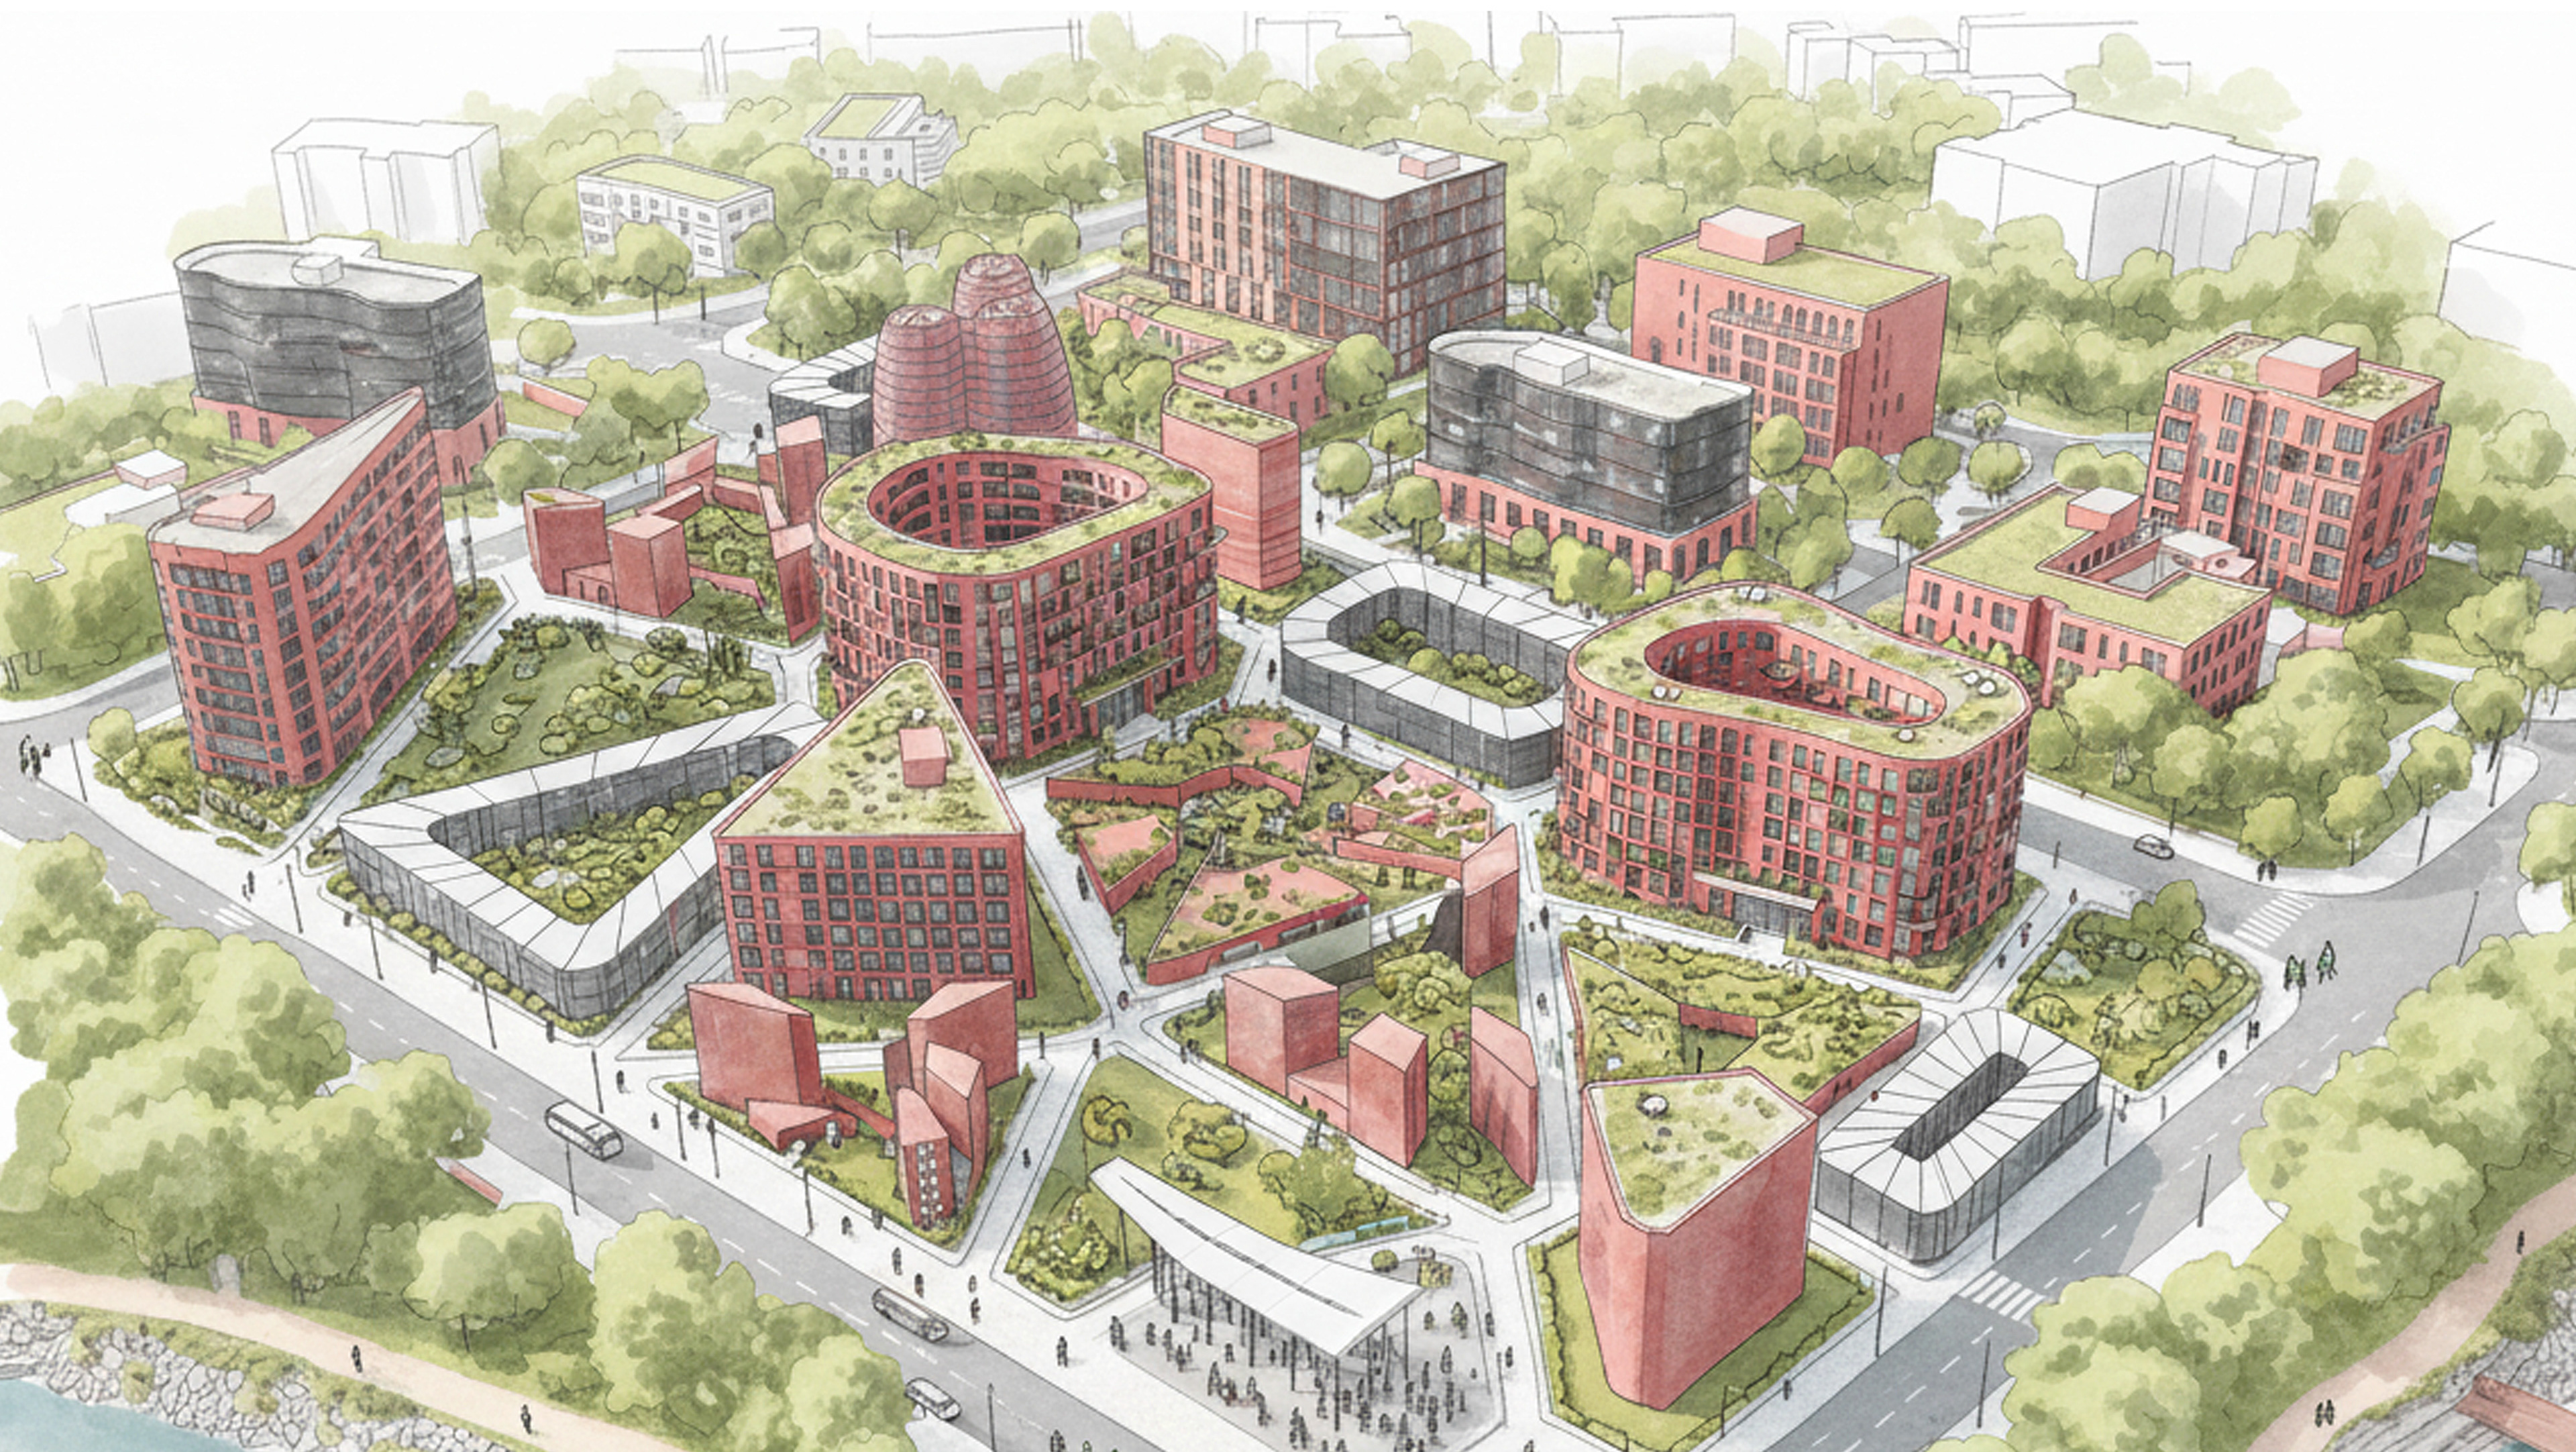
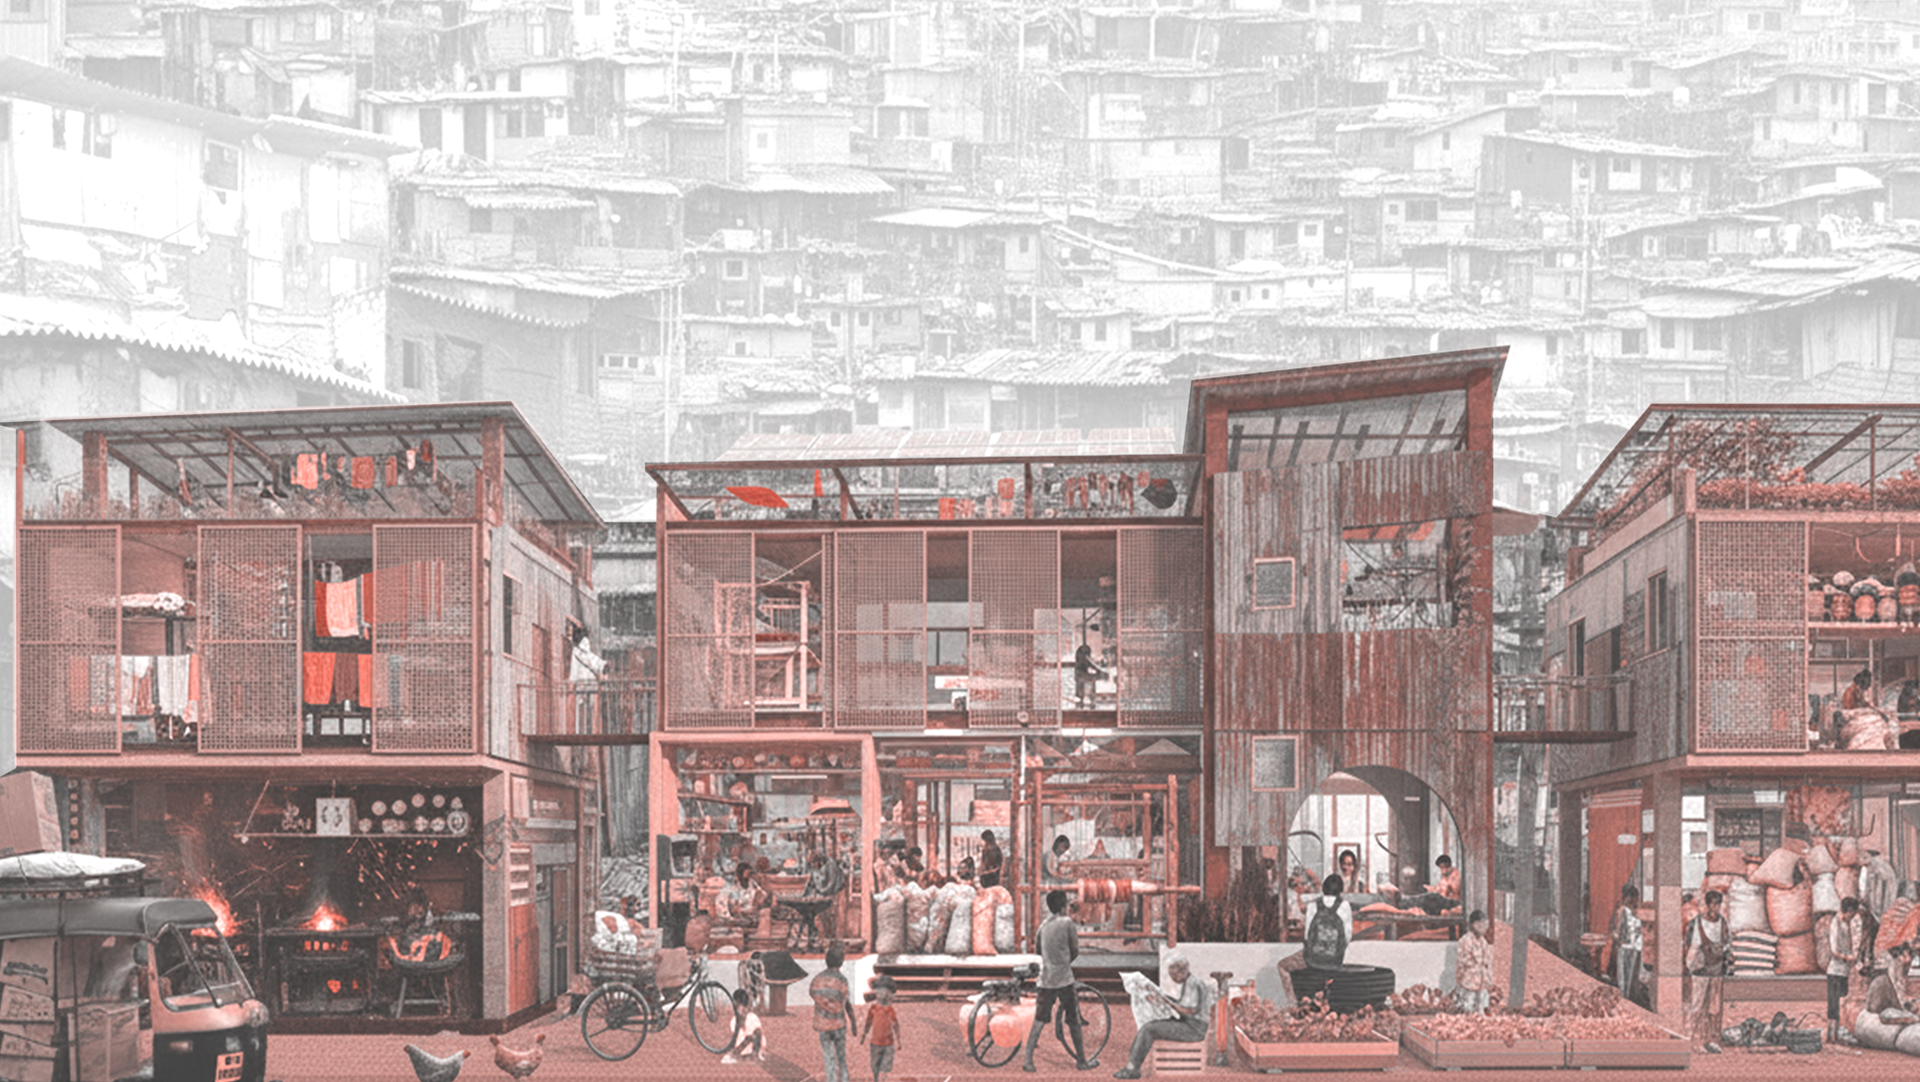
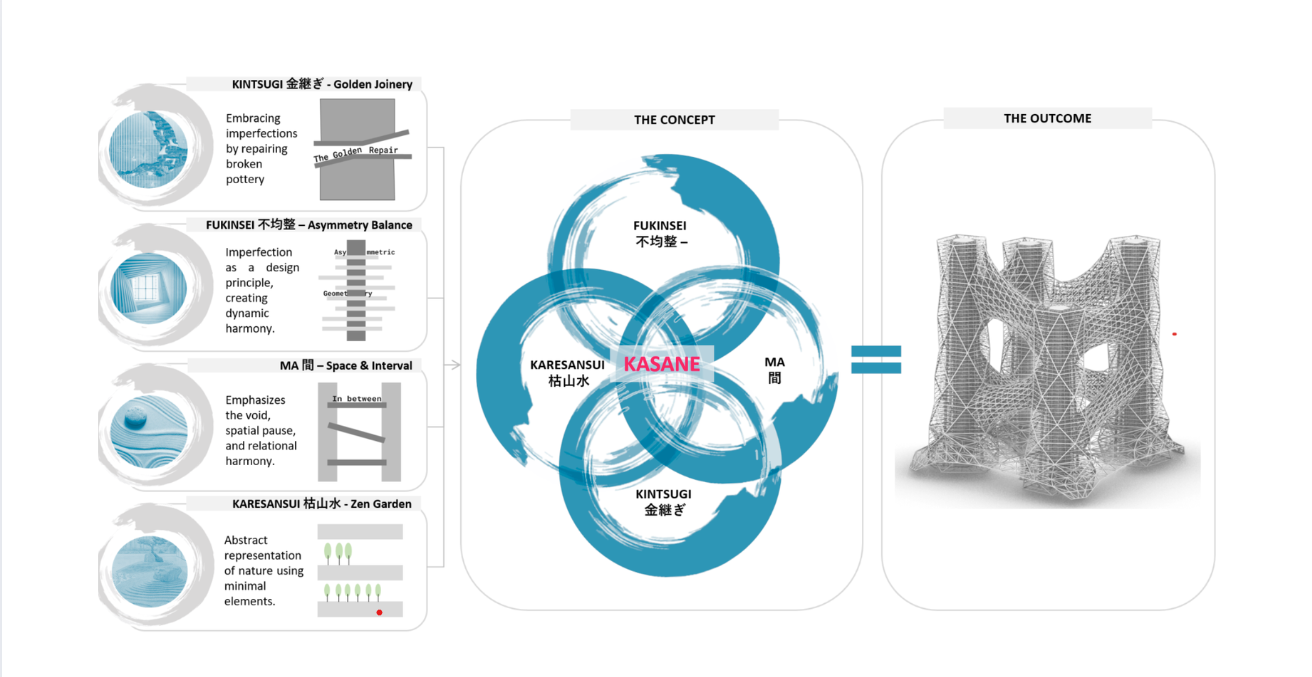
The final visualizations translate the underlying computational logic into an architectural expression. The diagrid exoskeleton, articulated façade, and multi-level podium reflect structural efficiency, environmental responsiveness, and programmatic integration. These images communicate how data-driven processes can produce complex yet coherent architectural form.
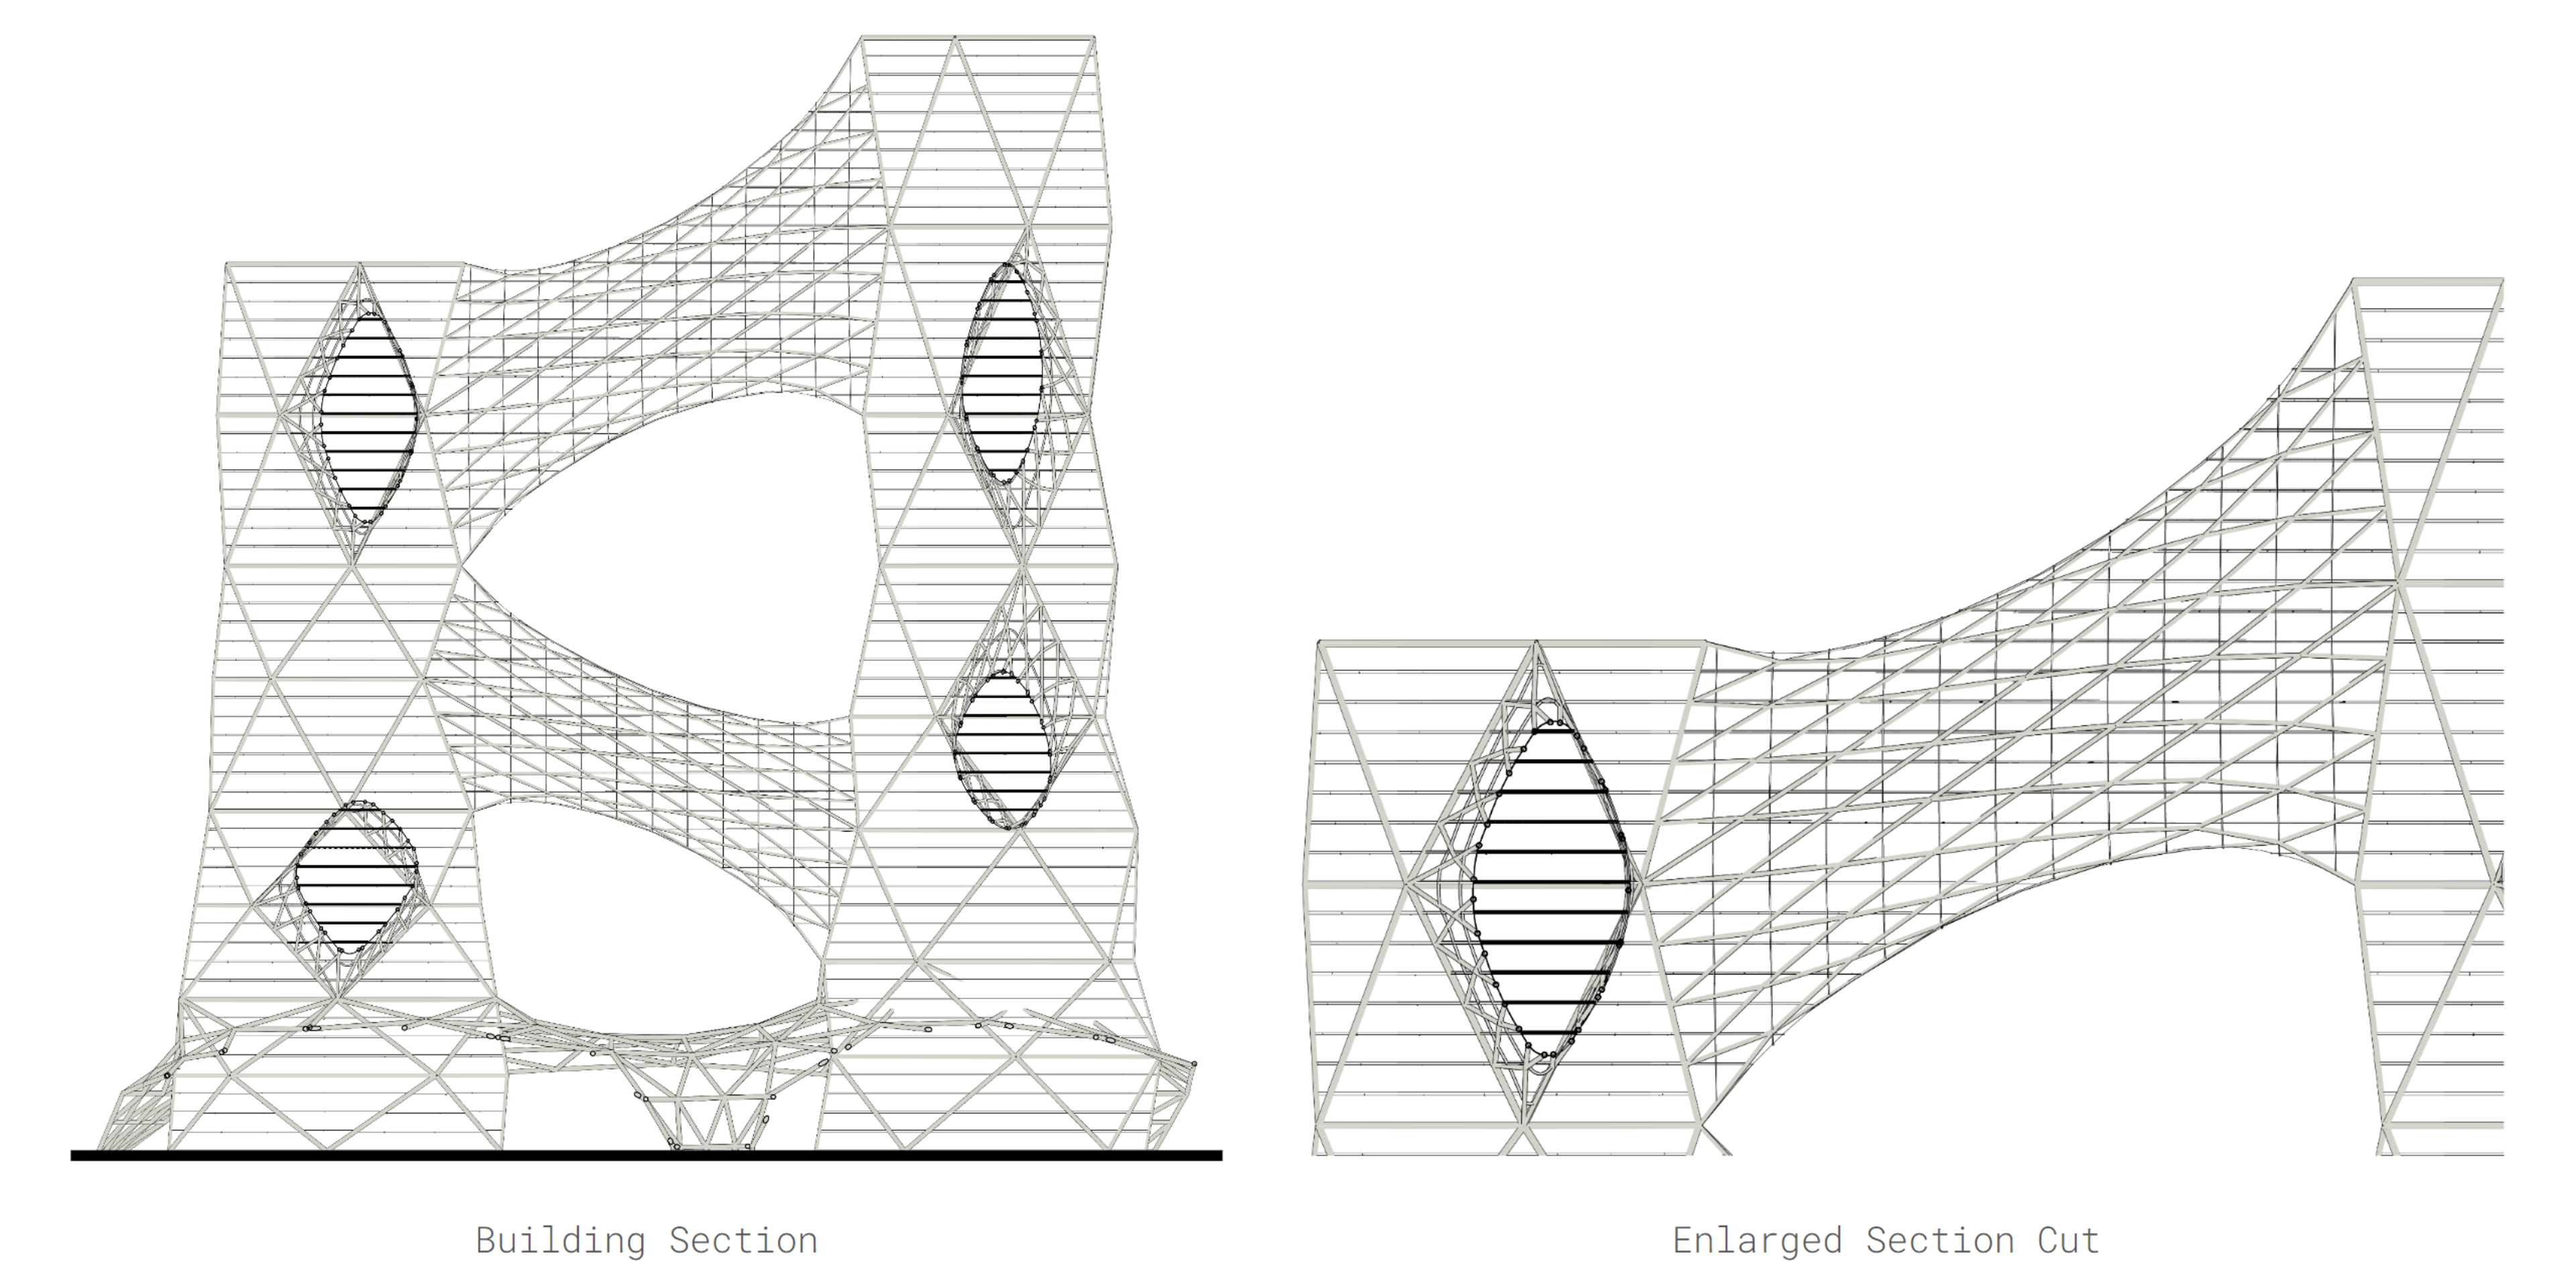
Sectional logic revealing structural, spatial, and environmental integration.
Diagrid exoskeleton as structure and spatial organizer.
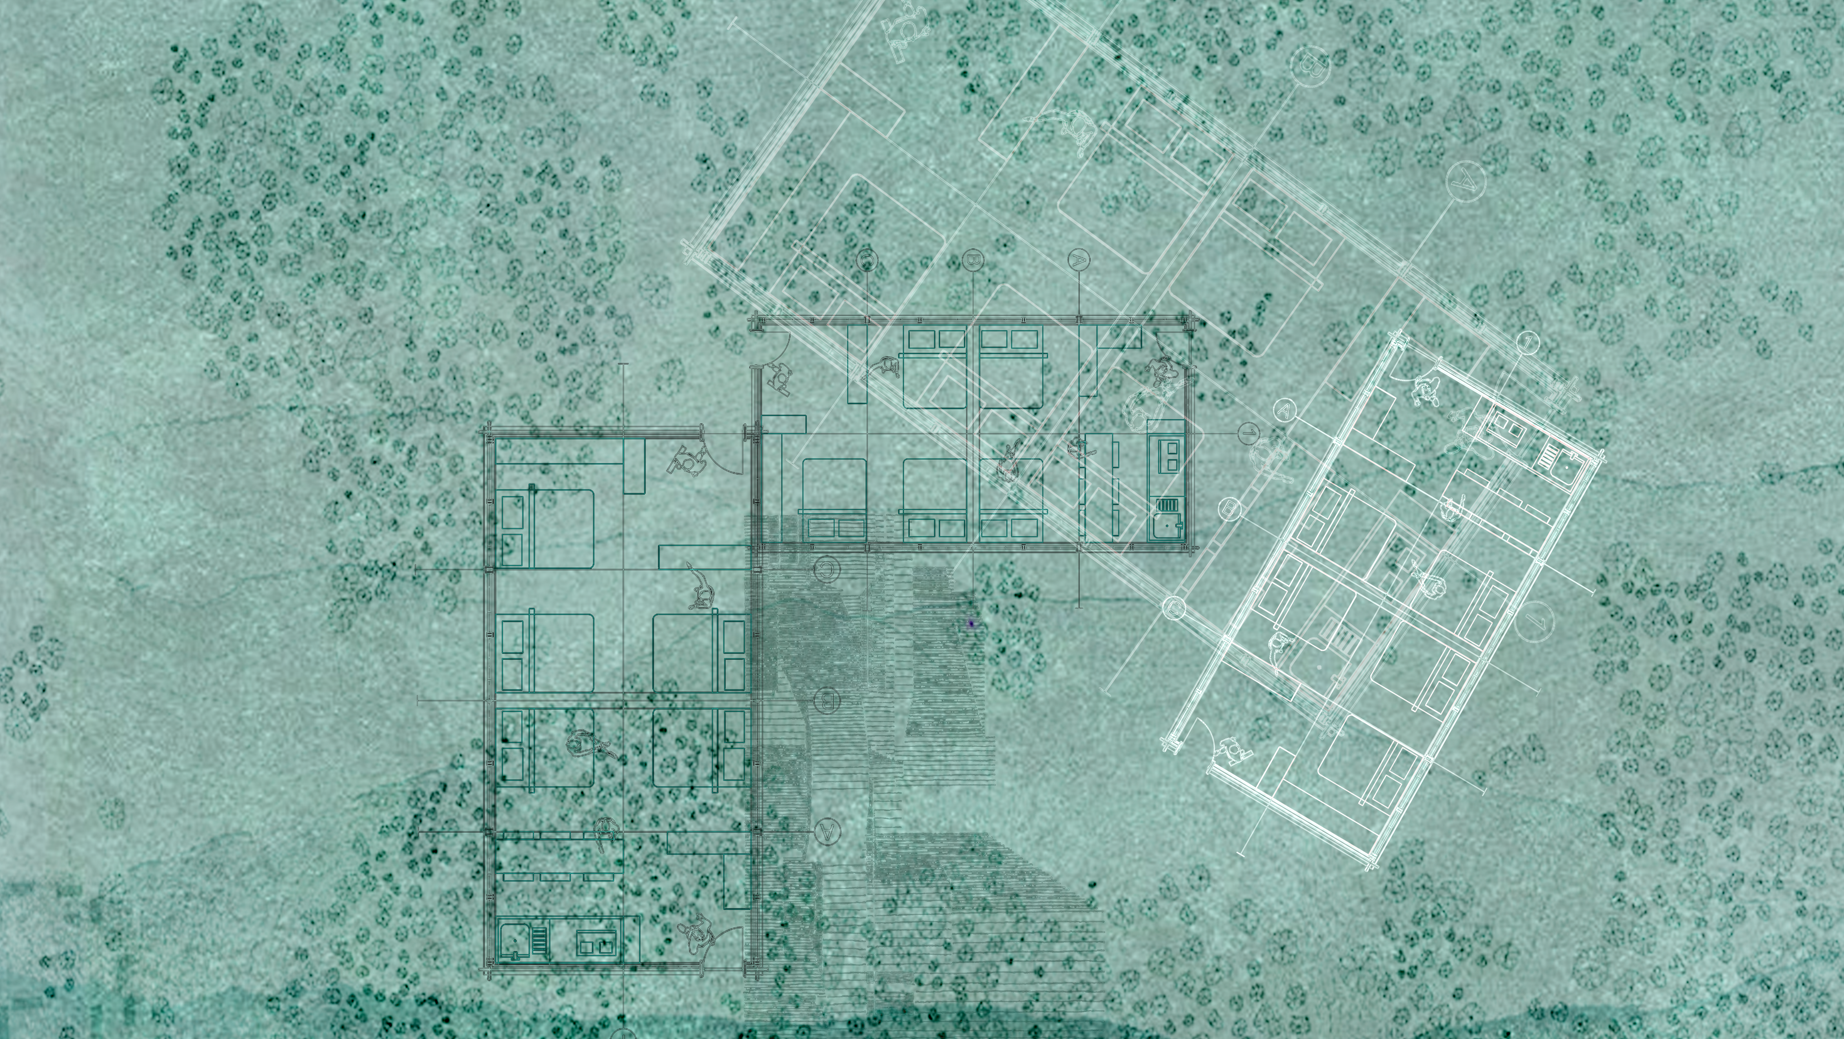
The sectional drawings reveal how vertical circulation, structure, and program are coordinated within the parametric framework. Terraces, voids, and interconnections are positioned to enhance daylight penetration and spatial continuity across floors. The sections demonstrate how performance criteria are resolved spatially, not just formally.